
Reason to trust
How Our News is Made
Strict editorial policy that focuses on accuracy, relevance, and impartiality
Ad discliamer
Morbi pretium leo et nisl aliquam mollis. Quisque arcu lorem, ultricies quis pellentesque nec, ullamcorper eu odio.
Bitcoin declined more than $1,500 in the past few days against the US Dollar. BTC is now facing a drop to $8,200 or $8,000 before a strong upward move in the coming days.
- After forming a short term top, bitcoin price dived below $9,000 and $8,800.
- The price is currently consolidating above $8,500, with a few bearish signals.
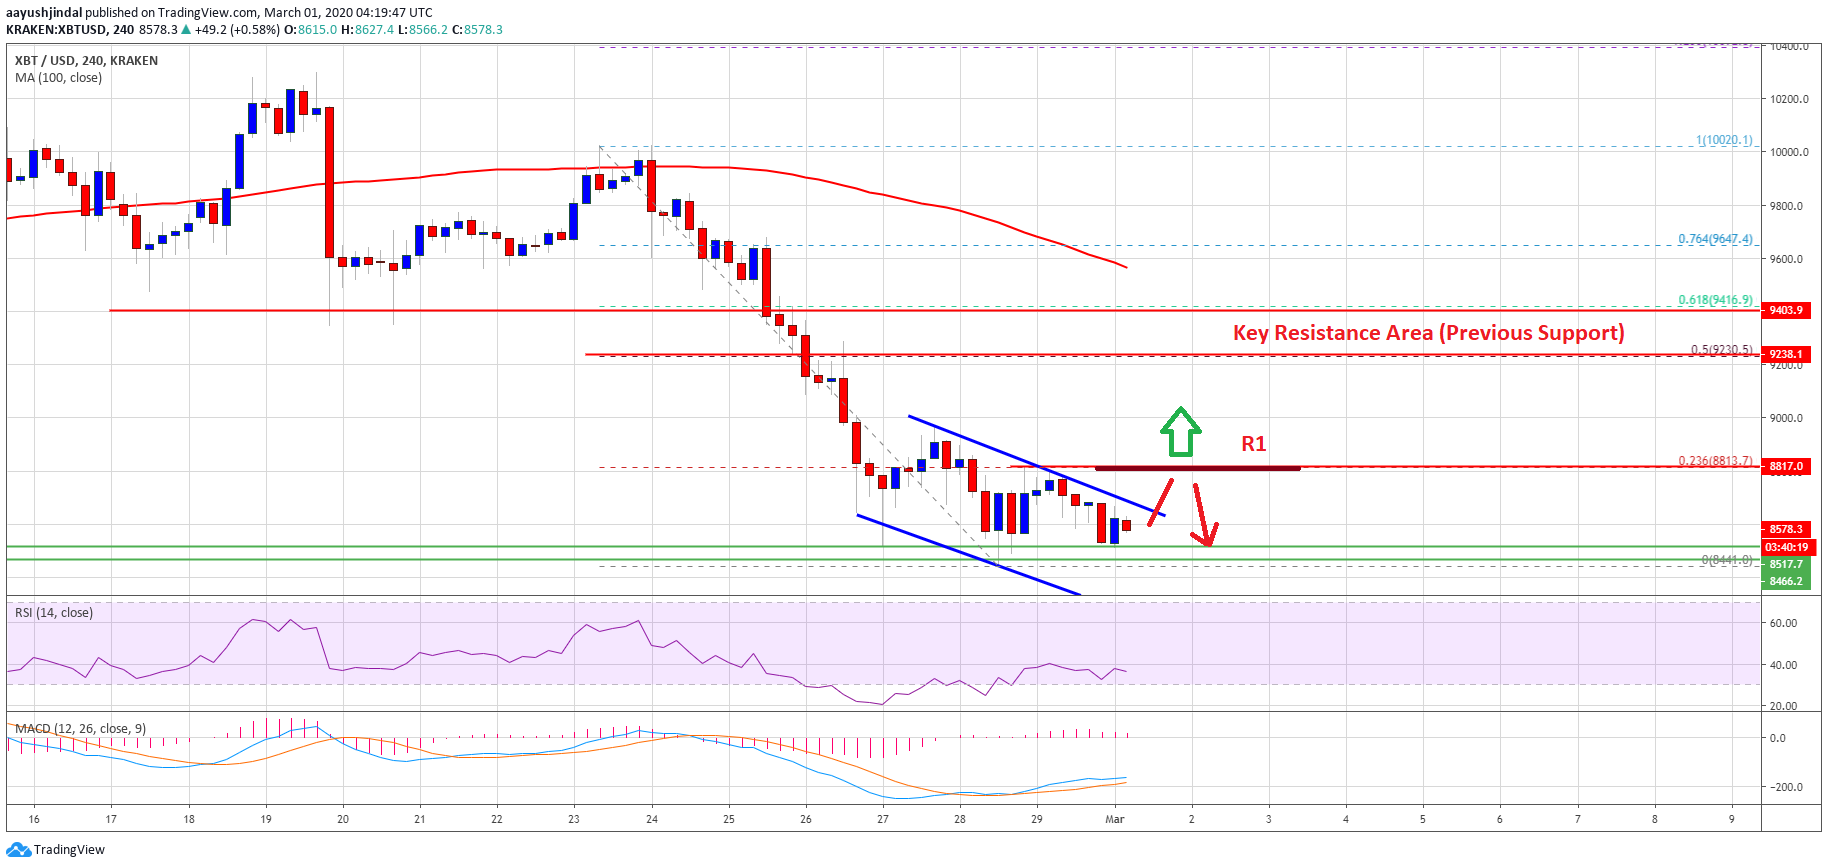
- There is a key declining channel forming with resistance near $8,660 on the 4-hours chart of the BTC/USD pair (data feed from Kraken).
- The pair could correct in the short term, but it remains vulnerable to a drop towards $8,000.
Bitcoin Could Dive Towards $8,000
This past week, bitcoin extended its decline below the $9,200 and $9,000 support levels against the US Dollar. BTC price even settled below $9,000 and the 100 simple moving average (4-hours).
It traded to a new weekly low at $8,441 and recently started consolidating losses. There was a minor upside correction above the $8,550 and $8,700 levels. Besides, there was a break above the 23.6% Fib retracement level of the key decline from the $10,020 high to $8,441 low.
However, the recent correction failed near the $8,950 and $9,000 levels. It seems like bitcoin bulls are struggling to gain momentum above the $8,800 level. There is also a key declining channel forming with resistance near $8,660 on the 4-hours chart of the BTC/USD pair.
On the downside, the $8,500 and $8,450 levels are initial supports. If the bulls fail to defend the recent low of $8,441, there is a risk of a sharp decline.
The next key supports on the downside are near the $8,200 and $8,000 levels, where the bulls are likely to take a strong stand (as discussed in one of the recent analyses using the daily chart).
Upside Correction
If there is a clear break above the channel resistance, bitcoin price could test the $8,820 resistance level. If the bulls manage to gain strength above $8,820, there are chances of a decent recovery towards the $9,200 resistance area.
The key breakout zone is near the $9,200 and $9,300 levels. The 50% Fib retracement level of the key decline from the $10,020 high to $8,441 low is also near the $9,230 level to act as a hurdle.
Therefore, upsides are likely to remain capped unless there is a solid rally above the $9,200 and $9,300 levels.
Technical indicators
4 hours MACD – The MACD for BTC/USD is about to move back in the bearish zone.
4 hours RSI (Relative Strength Index) – The RSI for BTC/USD is now well below the 40 level.
Major Support Level – $8,500
Major Resistance Level – $9,200


