
Reason to trust
How Our News is Made
Strict editorial policy that focuses on accuracy, relevance, and impartiality
Ad discliamer
Morbi pretium leo et nisl aliquam mollis. Quisque arcu lorem, ultricies quis pellentesque nec, ullamcorper eu odio.
Bitcoin is currently recovering from the $8,512 weekly low against the US Dollar. However, BTC price is still facing many key hurdles near $9,000 and it could resume its decline.
- Bitcoin is showing signs of a short term upside correction from $8,512 against the US Dollar.
- The bears are still in control unless there is a clear break above $9,000 and $9,200.
- There is likely a bearish flag forming with support near $8,735 on the hourly chart of the BTC/USD pair (data feed from Kraken).
- The pair could resume its decline below the $8,735 and $8,600 levels in the near term.
Bitcoin Is Facing Key Hurdles
This week, we saw a strong downward move in bitcoin below $9,000 and $8,800 against the US Dollar. BTC price even traded below the $8,680 support level and settled well below the 100 hourly simple moving average.
A new weekly low is formed near $8,512 and the price is currently correcting losses. It surpassed the $8,700 resistance level, and the 23.6% Fib retracement level of the downward move from the $9,281 high to $8,512 low.
On the upside, there are many resistances forming near the $9,000 and $9,200 levels. More importantly, there is likely a bearish flag forming with support near $8,735 on the hourly chart of the BTC/USD pair.
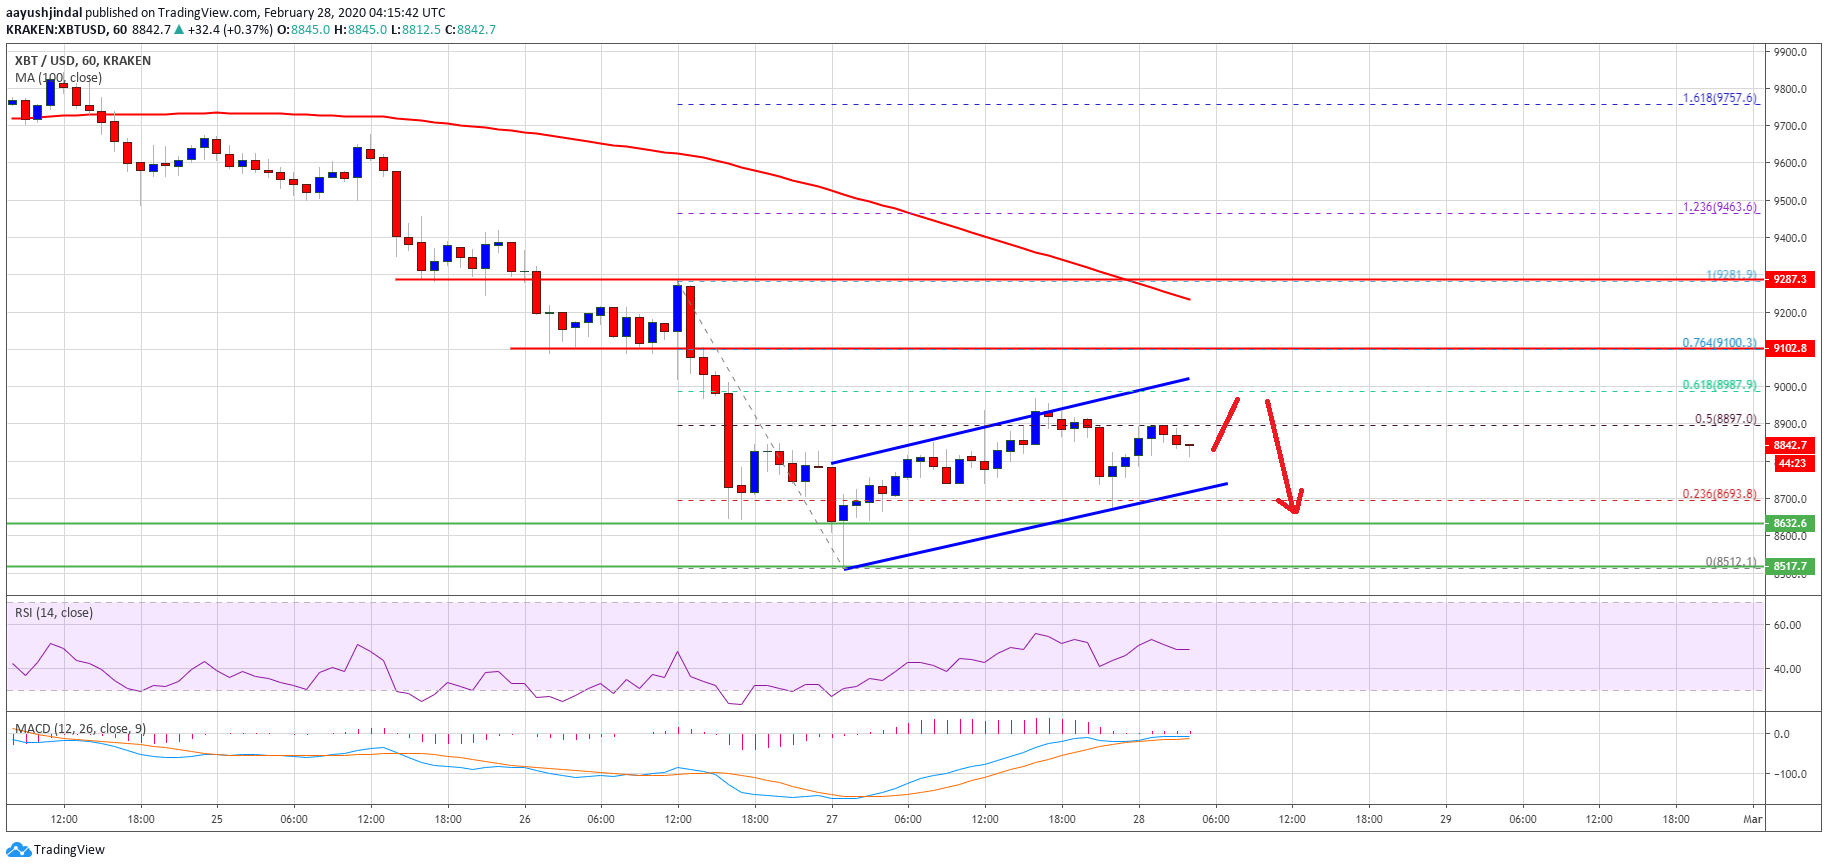
Bitcoin is currently struggling near the 50% Fib retracement level of the downward move from the $9,281 high to $8,512 low. The first key resistance is near the flag resistance at $9,000.
If the bulls gain strength above $9,000, the next important breakout zone is visible near the $9,200 level and the 100 hourly SMA. Therefore, the price must climb above the $9,000 and $9,200 levels to start a fresh increase in the coming sessions.
Fresh Drop
If bitcoin fails to correct above the $9,000 and $9,200 resistance levels, it is likely to resume its decline. An initial support is near the flag trend line at $8,735.
A successful break below the flag support could open the doors for a fresh decline below $8,700 and $8,600. In the mentioned case, the price could even decline below the $8,512 swing low.
The next major support and buy zone is near the $8,200 level (as discussed yesterday using the daily chart). In the medium term, bitcoin price is likely to bounce back as long as there is no daily close below $8,000.
Technical indicators:
Hourly MACD – The MACD is slowly moving in the bullish zone.
Hourly RSI (Relative Strength Index) – The RSI for BTC/USD is currently just below the 50 level.
Major Support Levels – $8,735 followed by $8,500.
Major Resistance Levels – $9,000, $9,200 and $9,280.


