Reason to trust
How Our News is Made
Strict editorial policy that focuses on accuracy, relevance, and impartiality
Ad discliamer
Morbi pretium leo et nisl aliquam mollis. Quisque arcu lorem, ultricies quis pellentesque nec, ullamcorper eu odio.
Ripple climbed above $0.2800, but it failed to continue above $0.2860 against the US Dollar. XRP price is currently declining towards the key $0.2700 and $0.2650 support levels.
- Ripple price topped near the $0.2860 level and declined recently against the US dollar.
- The price is now trading below the $0.2800 level, but there are still many supports on the downside.
- There was a break below a key bullish trend line with support near $0.2760 on the hourly chart of the XRP/USD pair (data source from Kraken).
- The price is likely to find a strong buying interest near $0.2700 or $0.2650.
Ripple Price Could Bounce Back
Recently, there was a steady increase in ripple from the $0.2650 support area. XRP price broke the $0.2800 resistance area and the 100 hourly simple moving average.
However, the bulls failed to lead the price toward the $0.3000 resistance. A swing high is formed near $0.2861 and the price recently started a fresh decline. It traded below the $0.2800 and $0.2780 levels to move into a short term bearish zone.
Besides, there was a break below a key bullish trend line with support near $0.2760 on the hourly chart of the XRP/USD pair. The pair even declined below the 50% Fib retracement level of the upward move from the $0.2714 low to $0.2861 high.
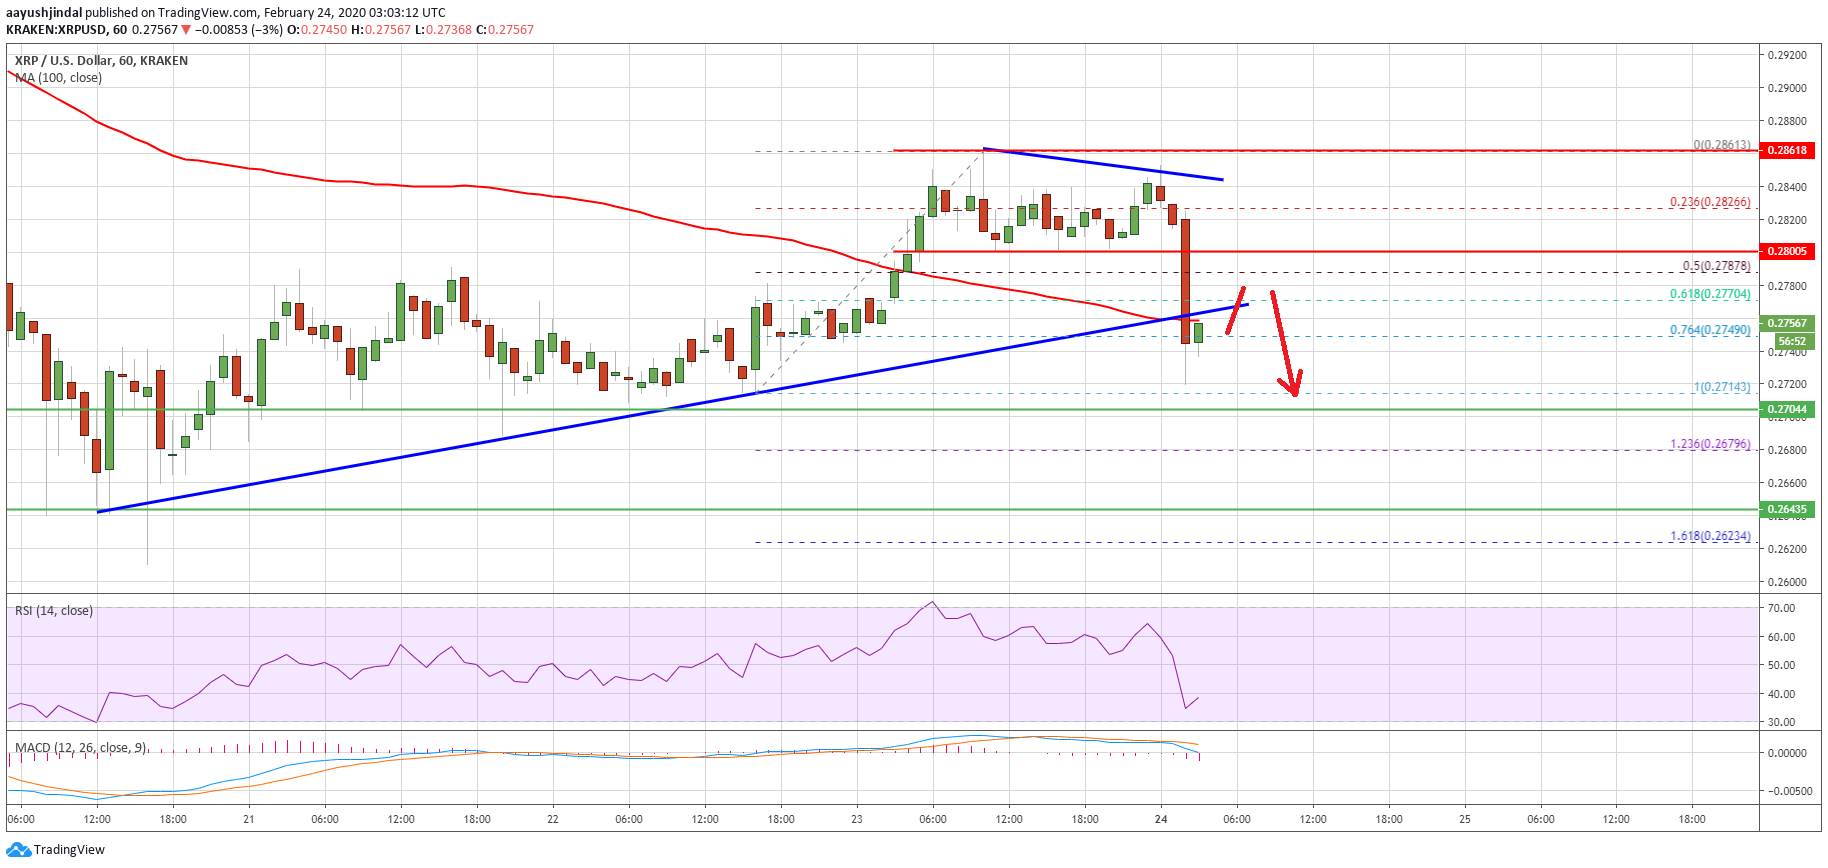
Ripple is now trading well below the $0.2780 level and the 100 hourly simple moving average. It is testing the 76.4% Fib retracement level of the upward move from the $0.2714 low to $0.2861 high.
On the downside, there are many supports near the $0.2700 and $0.2650 levels. On the upside, the 100 hourly SMA is an initial hurdle near $0.2760. The first key resistance is seen near the $0.2800 level, above which the bulls are likely to gain strength. In the mentioned case, the price could rise further towards $0.3000.
More Downsides?
If ripple fails to climb back above $0.2800, it could slide below the $0.2700 support. The next key support is near the $0.2650 and $0.2640 levels. An intermediate support is near the $0.2680 level since it is the 1.236 Fib extension of the upward move from the $0.2714 low to $0.2861 high.
Overall, there could be a downside extension in the short term, but the price is likely to bounce back from $0.2700 or $0.2650.
Technical Indicators
Hourly MACD – The MACD for XRP/USD is currently gaining pace in the bearish zone.
Hourly RSI (Relative Strength Index) – The RSI for XRP/USD is now well below the 50 level, with a bearish angle.
Major Support Levels – $0.2700, $0.2680 and $0.2650.
Major Resistance Levels – $0.2800, $0.2860 and $0.3000.