Ripple declined heavily from well above $0.3200 against the US Dollar. XRP price even dived below $0.3000 and it could continue to move down in the near term.
- Ripple price fell sharply after the bears were able to clear the $0.3000 support against the US dollar.
- The price traded as low as $0.2677 and it is currently correcting losses.
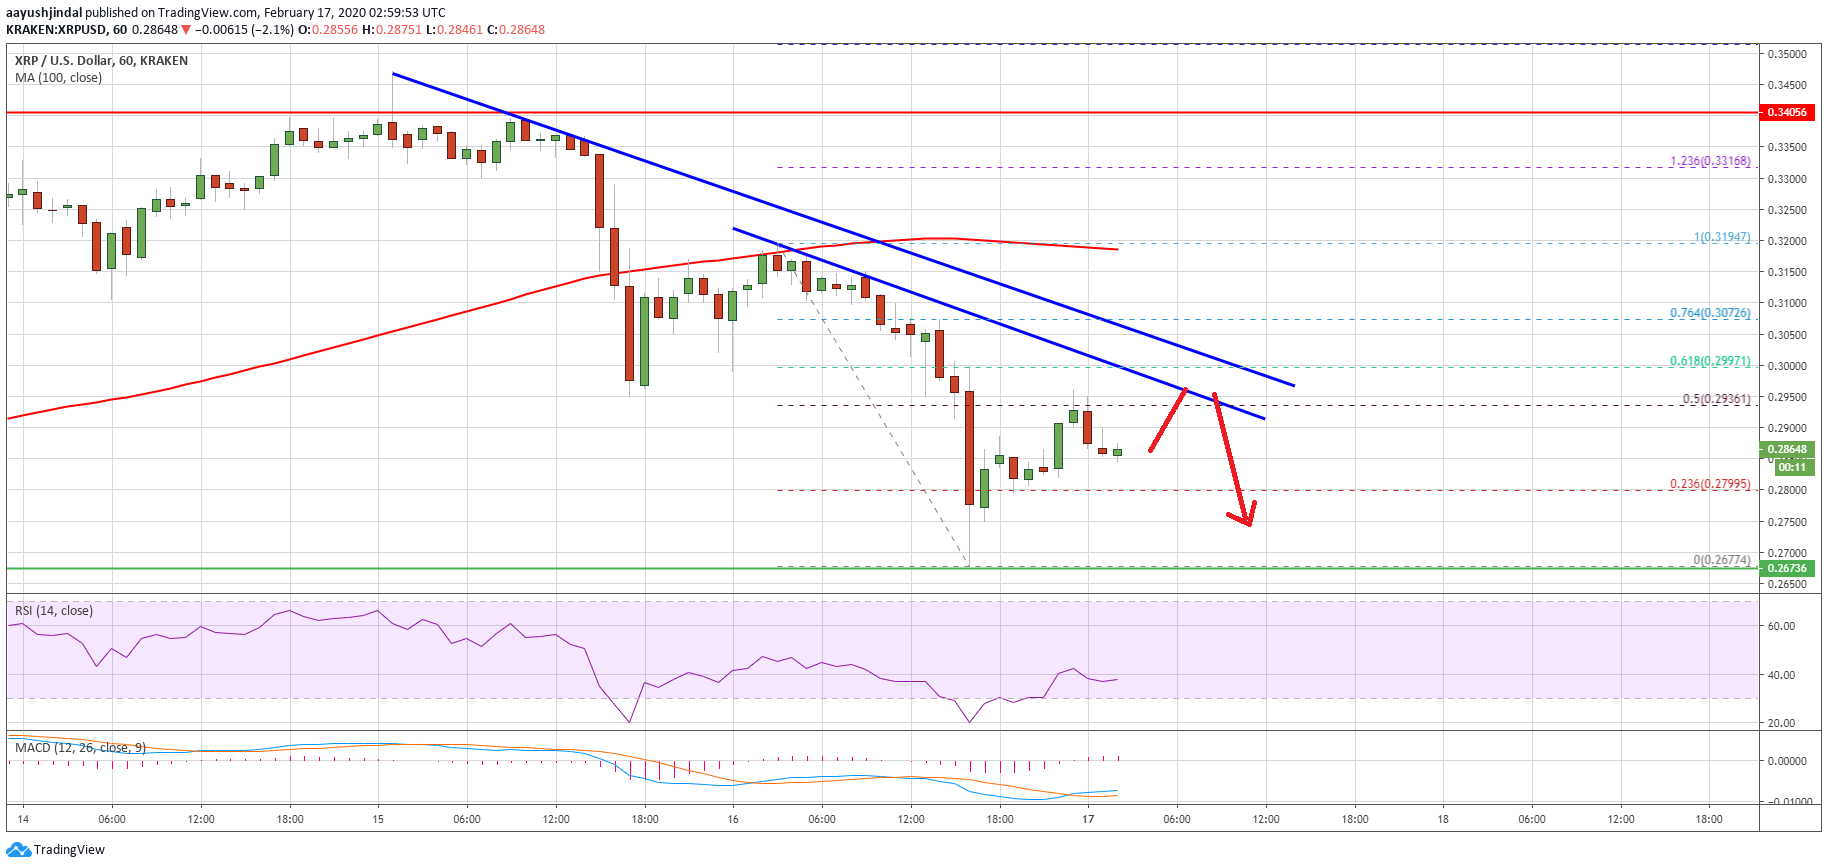
- There are two connecting bearish trend lines forming with resistance near $0.2950 and $0.3000 on the hourly chart of the XRP/USD pair (data source from Kraken).
- The price must climb back above $0.3000 to start a fresh increase in the coming sessions.
Ripple Price Could Extend Losses
In the past 3-4 sessions, ripple faced an increase in selling pressure below $0.3200. As a result, XRP declined heavily below the $0.3050 and $0.3000 support levels.
Moreover, there was a close below the $0.3000 support and the 100 hourly simple moving average. The price is down more than 10% and it traded as low as $0.2677. Recently, there was a minor upside correction above the $0.2800 level.
Besides, the price recovered above the 23.6% Fib retracement level of the recent dive from the $0.3194 high to $0.2677 low. However, ripple is facing a lot of hurdles on the upside near $0.2940 and $0.2950.
More importantly, there are two connecting bearish trend lines forming with resistance near $0.2950 and $0.3000 on the hourly chart of the XRP/USD pair.

The 50% Fib retracement level of the recent dive from the $0.3194 high to $0.2677 low is also acting as a hurdle for the bulls. Therefore, the bulls need to gain pace above the $0.2950 and $0.3000 resistance levels to push the price back into a positive zone.
If the bulls fail to gain strength above $0.2950, there is a risk of more losses. The first key support is near the $0.2800 level. If there is a clear break below $0.2800 and $0.2780, the bears are likely to aim a new weekly low below $0.2670.
Fresh Increase?
As mentioned, the bulls need to gain pace above the $0.2950 and $0.3000 resistance levels. If they succeed and ripple settles above $0.3000, there could be a fresh increase.
The next key resistance is near the $0.3200 area and the 100 hourly simple moving average, above which the price could revisit the $0.3400 resistance area.
Technical Indicators
Hourly MACD – The MACD for XRP/USD is slowly moving in the bullish zone.
Hourly RSI (Relative Strength Index) – The RSI for XRP/USD is now below the 40 level, with negative signs.
Major Support Levels – $0.2800, $0.2780 and $0.2680.
Major Resistance Levels – $0.2940, $0.2950 and $0.3000.


