
Reason to trust
How Our News is Made
Strict editorial policy that focuses on accuracy, relevance, and impartiality
Ad discliamer
Morbi pretium leo et nisl aliquam mollis. Quisque arcu lorem, ultricies quis pellentesque nec, ullamcorper eu odio.
Bitcoin price revered losses and climbed to a new 2020 high at $10,406 against the US Dollar. BTC is now eyeing another bullish wave above $10,500 in the near term.
- Bitcoin is gaining bullish momentum above the $10,000 and $10,200 resistance levels against the US Dollar.
- The price is likely to continue higher above $10,400 and $10,500 in the near term.
- There is a bullish continuation pattern forming with resistance near $10,385 on the hourly chart of the BTC/USD pair (data feed from Kraken).
- There are chances of a bullish break above the $10,406 high and $10,500.
Bitcoin Rally Could Extend Further
Recently, we saw a downside correction in bitcoin below the $10,000 and $9,850 support levels against the US Dollar. BTC price tested the $9,700 area and formed a decent support base.
As a result, there was a fresh increase above the $9,850 resistance and the 100 hourly simple moving average. Moreover, yesterday’s declining channel was breached near the $9,760 level.
It opened the doors for more gains above the $10,000 barrier. Finally, bitcoin rallied above the $10,200 resistance and traded to a new 2020 high at $10,406. It is currently correcting gains below $10,350.
It tested the 23.6% Fib retracement level of the recent surge from the $9,709 low to $10,406 high. However, the price remained well bid above the $10,200 level. More importantly, there is a bullish continuation pattern forming with resistance near $10,385 on the hourly chart of the BTC/USD pair.
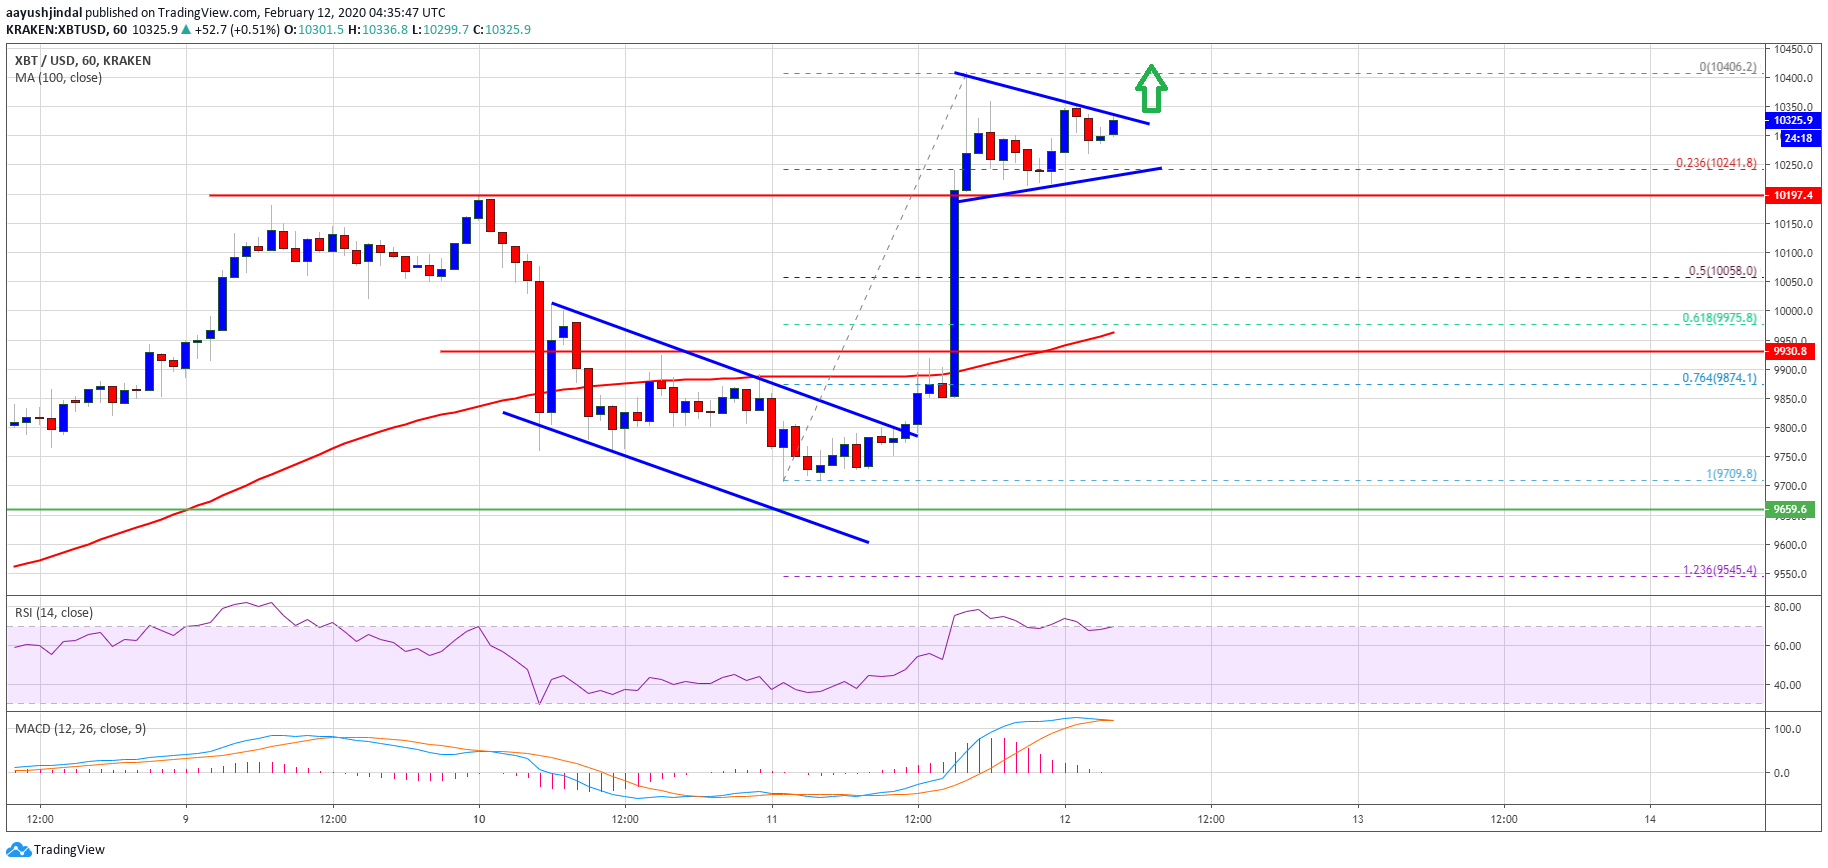
A clear break above the triangle resistance and $10,400 could accelerate gains in the coming sessions. The next resistance is near $10,500, above which the price is likely to surge towards the $10,800 and $11,000 levels.
Dips Remain Supported
On the downside, there are many supports forming near the $10,200 level. If bitcoin starts another correction below $10,200, it could slide towards the $10,050 support area.
The 50% Fib retracement level of the recent surge from the $9,709 low to $10,406 high is near the $10,050 level to act as a decent support. The next major support is seen near the $9,970 level since it is close to the 100 hourly simple moving average. Any further losses may perhaps start a strong decline towards $9,500.
Technical indicators:
Hourly MACD – The MACD is now gaining momentum in the bullish zone.
Hourly RSI (Relative Strength Index) – The RSI for BTC/USD is rising and it is well above the 65 level.
Major Support Levels – $10,200 followed by $10,050.
Major Resistance Levels – $10,400, $10,500 and $11,000.