
Reason to trust
How Our News is Made
Strict editorial policy that focuses on accuracy, relevance, and impartiality
Ad discliamer
Morbi pretium leo et nisl aliquam mollis. Quisque arcu lorem, ultricies quis pellentesque nec, ullamcorper eu odio.
Bitcoin price climbed steadily above the $10,000 resistance against the US Dollar. However, BTC could correct lower towards $9,850 before it rallies towards the $10,500 area.
- Bitcoin is currently facing resistance near the $10,200 area against the US Dollar.
- The price is now showing signs of a downside correction below the $10,000 level.
- There was a break below a key bullish trend line with support near $10,100 on the hourly chart of the BTC/USD pair (data feed from Kraken).
- It seems like the bears are eyeing a test of the key $9,850 support area in the near term.
Bitcoin Could Correct In Short Term
In the past few days, there was a steady increase in bitcoin above the $9,500 and $9,850 resistance levels against the US Dollar. BTC even climbed above the $10,000 barrier and settled well above the 100 hourly simple moving average.
Finally, the price tested the $10,200 area and a new 2020 high is formed near $10,201. The price is currently correcting lower below the $10,100 level. It broke the 23.6% Fib retracement level of the recent wave from the $9,658 low to $10,201 high.
Moreover, there was a break below a key bullish trend line with support near $10,100 on the hourly chart of the BTC/USD pair. Bitcoin price is now trading below the $10,050 level.
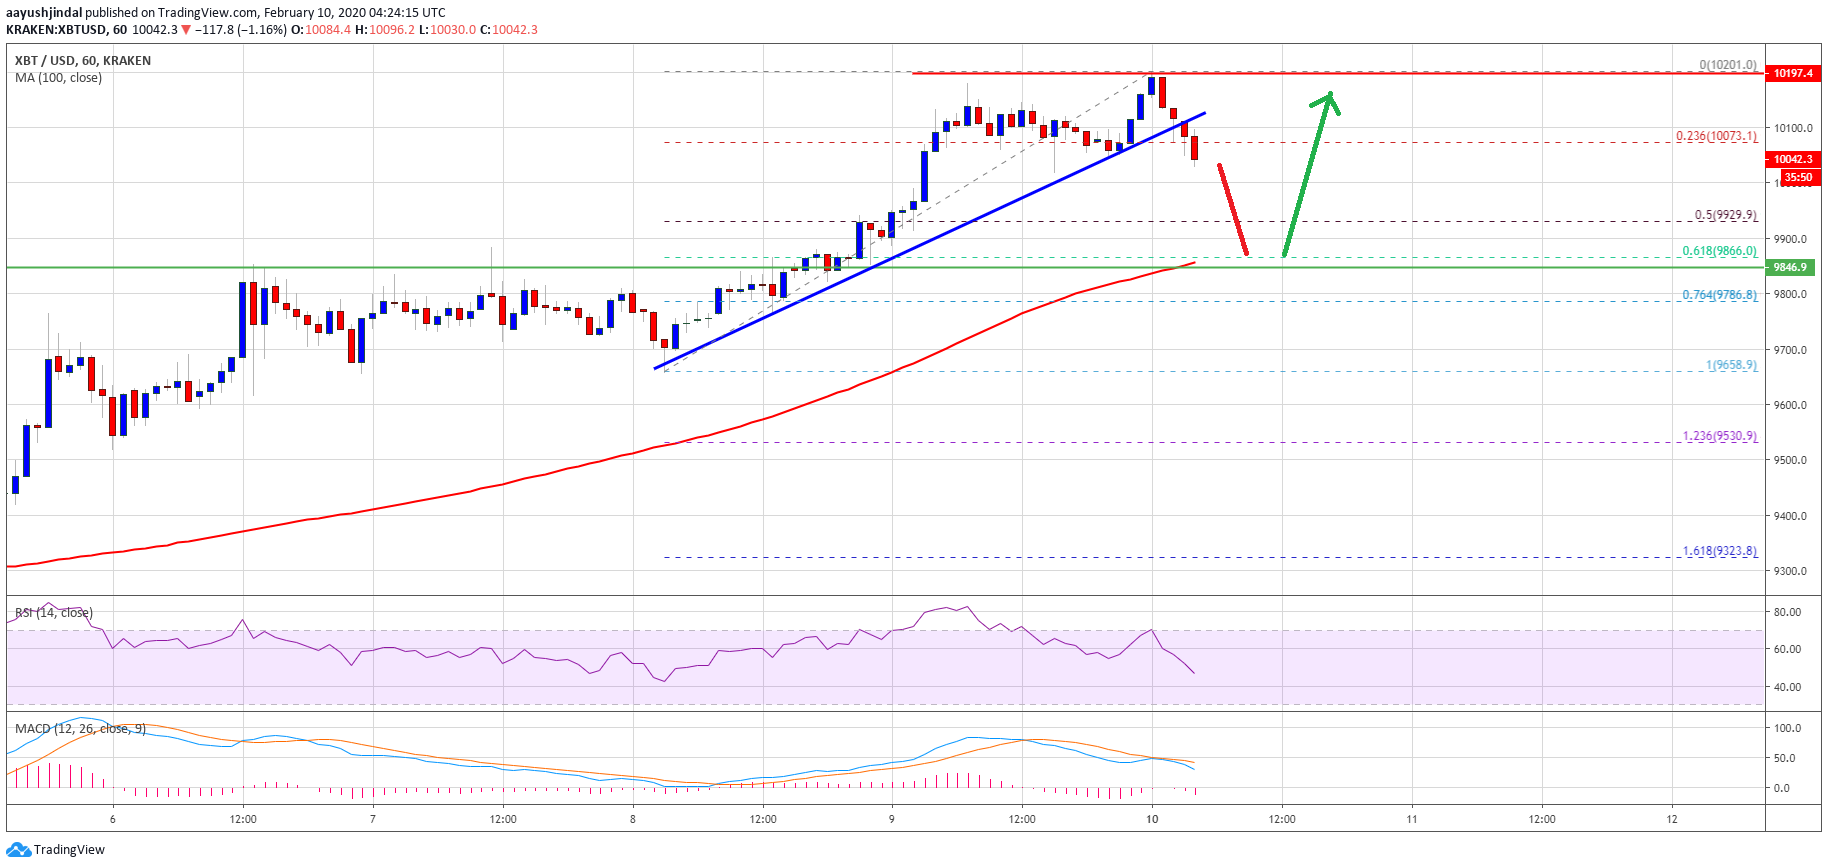
An immediate support is near the $10,000 level. The first key support is near the $9,930 level since it is close to the 50% Fib retracement level of the recent wave from the $9,658 low to $10,201 high.
The main support is near the $9,850 level, where bitcoin bulls are likely to emerge again. Any further losses may perhaps damage the current bullish market sentiment and the price might slide towards $9,500.
Dips Present Buying Opportunity?
The current price action suggests that bitcoin price is correcting lower from the $10,201 high. If there is a break below the $10,000 support, the price will most likely test the $9,850 support.
Having said that, the price is still in a strong uptrend and a short term correction towards $9,850 could be considered as a decent buying opportunity. Besides, only a daily close below the $9,500 area might start a substantial downside correction.
Technical indicators:
Hourly MACD – The MACD is slowly gaining pace in the bearish zone.
Hourly RSI (Relative Strength Index) – The RSI for BTC/USD is declining and it is now below the 50 level.
Major Support Levels – $10,000 followed by $9,850.
Major Resistance Levels – $10,150, $10,200 and $10,500.