
Reason to trust
How Our News is Made
Strict editorial policy that focuses on accuracy, relevance, and impartiality
Ad discliamer
Morbi pretium leo et nisl aliquam mollis. Quisque arcu lorem, ultricies quis pellentesque nec, ullamcorper eu odio.
Ripple surged higher recently above the $0.2650 and $0.2720 resistances against the US Dollar. XRP price remains well supported and it could soon rally to $0.3000 if it breaks $0.2810.
- Ripple price rallied to a new 2020 high at $0.2811 and it is consolidating gains against the US dollar.
- The price remains well supported on the downside near the $0.2730 and $0.2700 levels.
- There is a key contracting triangle forming with resistance near $0.2788 on the hourly chart of the XRP/USD pair (data source from Kraken).
- The pair is likely to start a sharp rally towards $0.3000 once it breaks the $0.2810 resistance area.
Ripple Price Rally Could Gain Pace
In the past few sessions, there were strong gains in ripple above the $0.2650 resistance. XRP price even broke the $0.2720 and $0.2750 resistance levels.
Finally, there was a break above the $0.2800 level and the price settled nicely above the 100 hourly simple moving average. A new 2020 high is formed near $0.2811 and the price is currently consolidating gains.
There was a break below the 23.6% Fib retracement level of the recent wave from the $0.2617 low to $0.2811 high. However, the price is finding strong bids above the $0.2720 and $0.2710 levels.
Moreover, there is a key contracting triangle forming with resistance near $0.2788 on the hourly chart of the XRP/USD pair. If the price continues to consolidate, there are high chances of an upside break above the triangle resistance and $0.2800.
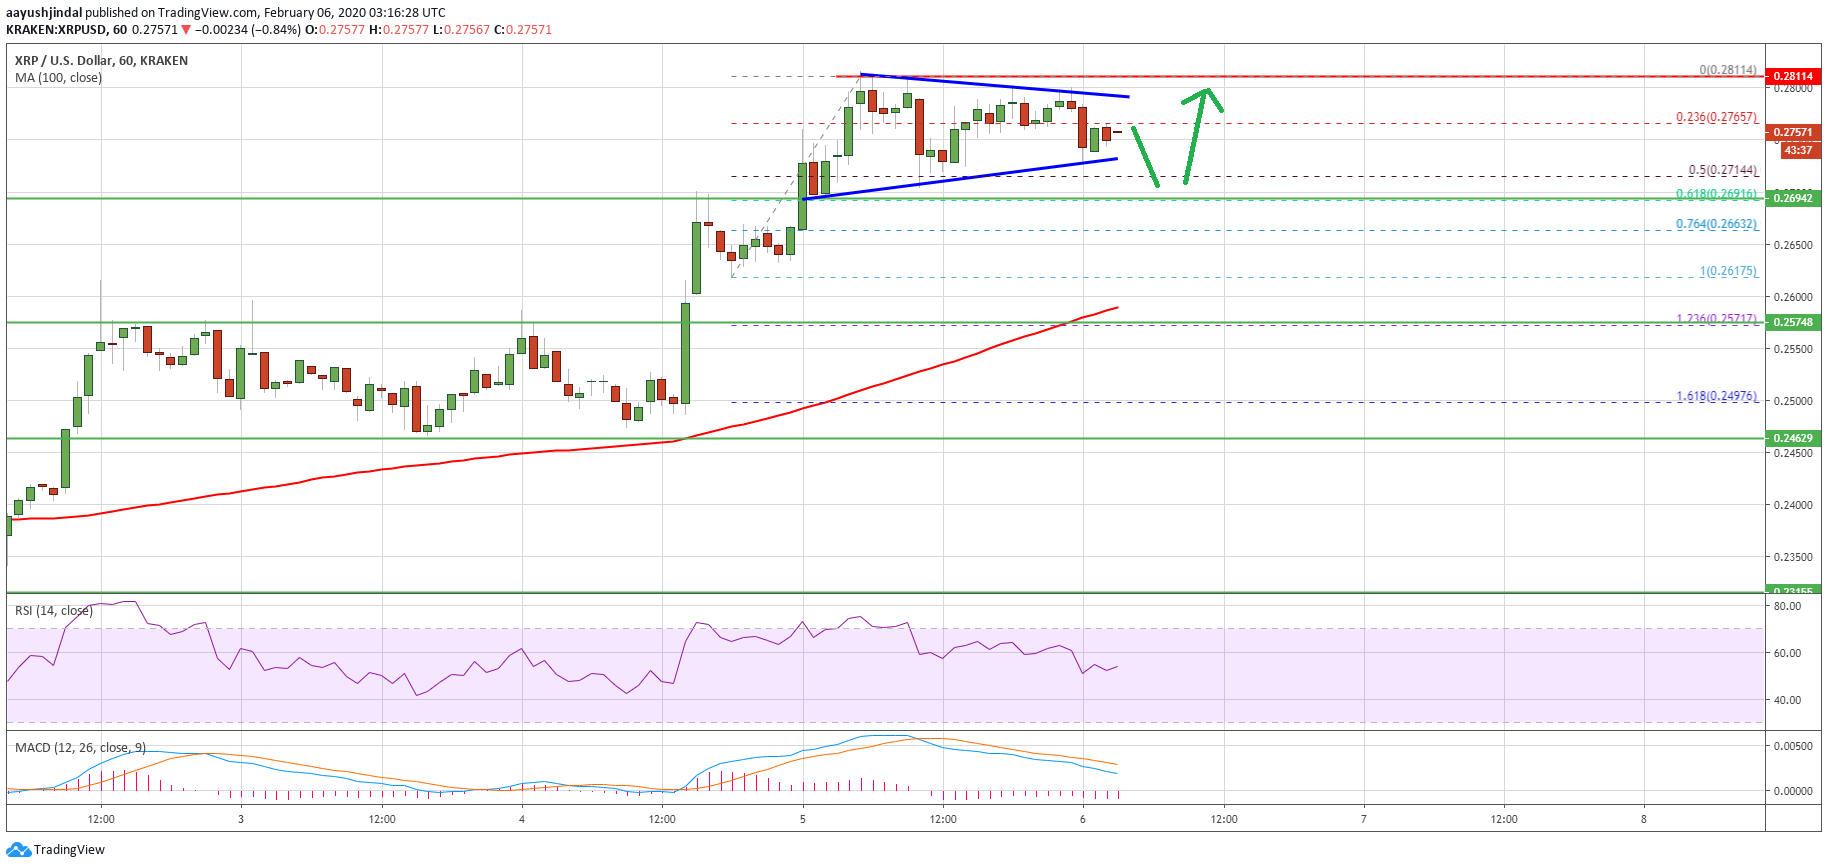
Ripple bulls need to gain pace above the $0.2810 resistance area to set the pace for a larger rally. In the mentioned case, the price is likely to surge towards the $0.2880 and $0.2920 levels. The next major hurdle for the bulls is near the $0.3000 handle.
Bulls Remain in Action
On the downside, there are many supports near the $0.2700 area. Besides, the 50% Fib retracement level of the recent wave from the $0.2617 low to $0.2811 high is at $0.2714.
Any further losses may perhaps push the price towards the $0.2695 support area. If ripple fails to stay above the $0.2695 support, it could extend its decline below $0.2680. In the mentioned case, the price might continue to decline towards the $0.2600 area or the 100 hourly SMA.
Technical Indicators
Hourly MACD – The MACD for XRP/USD is likely to move back into the bullish zone.
Hourly RSI (Relative Strength Index) – The RSI for XRP/USD is currently rising and it could soon clear the 60 level.
Major Support Levels – $0.2715, $0.2695 and $0.2620.
Major Resistance Levels – $0.2800, $0.2810 and $0.2880.