Reason to trust

How Our News is Made
Strict editorial policy that focuses on accuracy, relevance, and impartiality
Ad discliamer
Morbi pretium leo et nisl aliquam mollis. Quisque arcu lorem, ultricies quis pellentesque nec, ullamcorper eu odio.
Litecoin, the silver counterpart to Bitcoin as digital gold, is often a leading indicator across the crypto market.
If one particular Litecoin chart is accurate, it could be signaling an epic plunge in altcoins against Bitcoin in the coming months.
Litecoin Leads the Way in Crypto, But Is It Toward an Epic Plunge?
Ever since the crypto bubble popped, altcoins have been falling in value to absolute extremes.
As much as 99% of the value has been completely erased from many top altcoins that were all the rage at the height of the bubble-induced irrational exuberance.
Related Reading | Litecoin Gains 10% Against The Dollar, Is This The Start of an Altcoin Rally?
At the start of last year, altcoins like Litecoin and others showed a glimmer of hope that their woes were reversing.
Buzz surrounding Litecoin’s halving last year helped cause the altcoin to rise as much as 600% at its highs.
During this time, Litecoin led the crypto market into a reversal. But the reversal was later dominated by Bitcoin, which went on a parabolic rally from April 2019 to June 2019.
The monstrous rally in Bitcoin absorbed more of what little remaining value from the altcoin market, including Litecoin, which fell back to a low of around $35.
Not only did Litecoin lead the original rally, but it also led the market in decline following Bitcoin’s rally.
Once again, Litecoin has been leading the market, causing other altcoins to break out from downtrend resistance and help propel even Bitcoin to local highs.
The crypto market is convinced a new uptrend is forming, however, this may only be true for Bitcoin.

LTC/BTC Chart Shows Multi-Year Head and Shoulders Top
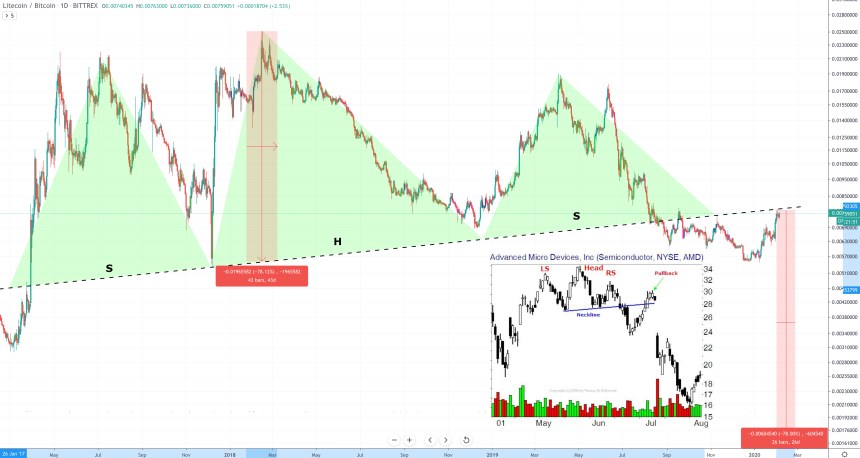
According to the LTC/BTC price chart, Litecoin could be forming a massive, multi-year head and shoulders top that could cause serious destruction to not only the value of Litecoin, but the entire altcoin market.
Altcoins typically rise and fall in tandem, and heavily rely on Bitcoin’s trend to dictate overall direction. However, oftentimes Bitcoin’s rallies cannibalize altcoins as a result of FOMO from one crypto asset to another.
Head and shoulders top targets are typically measured by the height of the head from the base of the trend line. This would result in an over 70% drop in Litecoin against Bitcoin on the LTC/BTC trading pair.
It also could mean a significant drop further in altcoins across the board, as Litecoin has historically acted as a leading indicator for the rest of the market.
Related Reading | Litecoin Lights Path To Crypto Market Bottom, Halving Nothing but Hype
Head and shoulders tops often also often result in a strong throwback to support turned resistance as can be seen in the chart examples above. This throwback would explain the current bullish rally, but would ultimately cause the rally to fail as a bearish retest before an epic plunge deeper.


