Ripple gained recently and broke the $0.2450 and $0.2500 resistance levels against the US Dollar. XRP price is currently correcting, but it is likely to continue higher towards $0.3000.
- Ripple price climbed higher and traded to a new monthly high at $0.2616 against the US dollar.
- The price is currently correcting lower, but dips remain supported near $0.2480 and $0.2450.
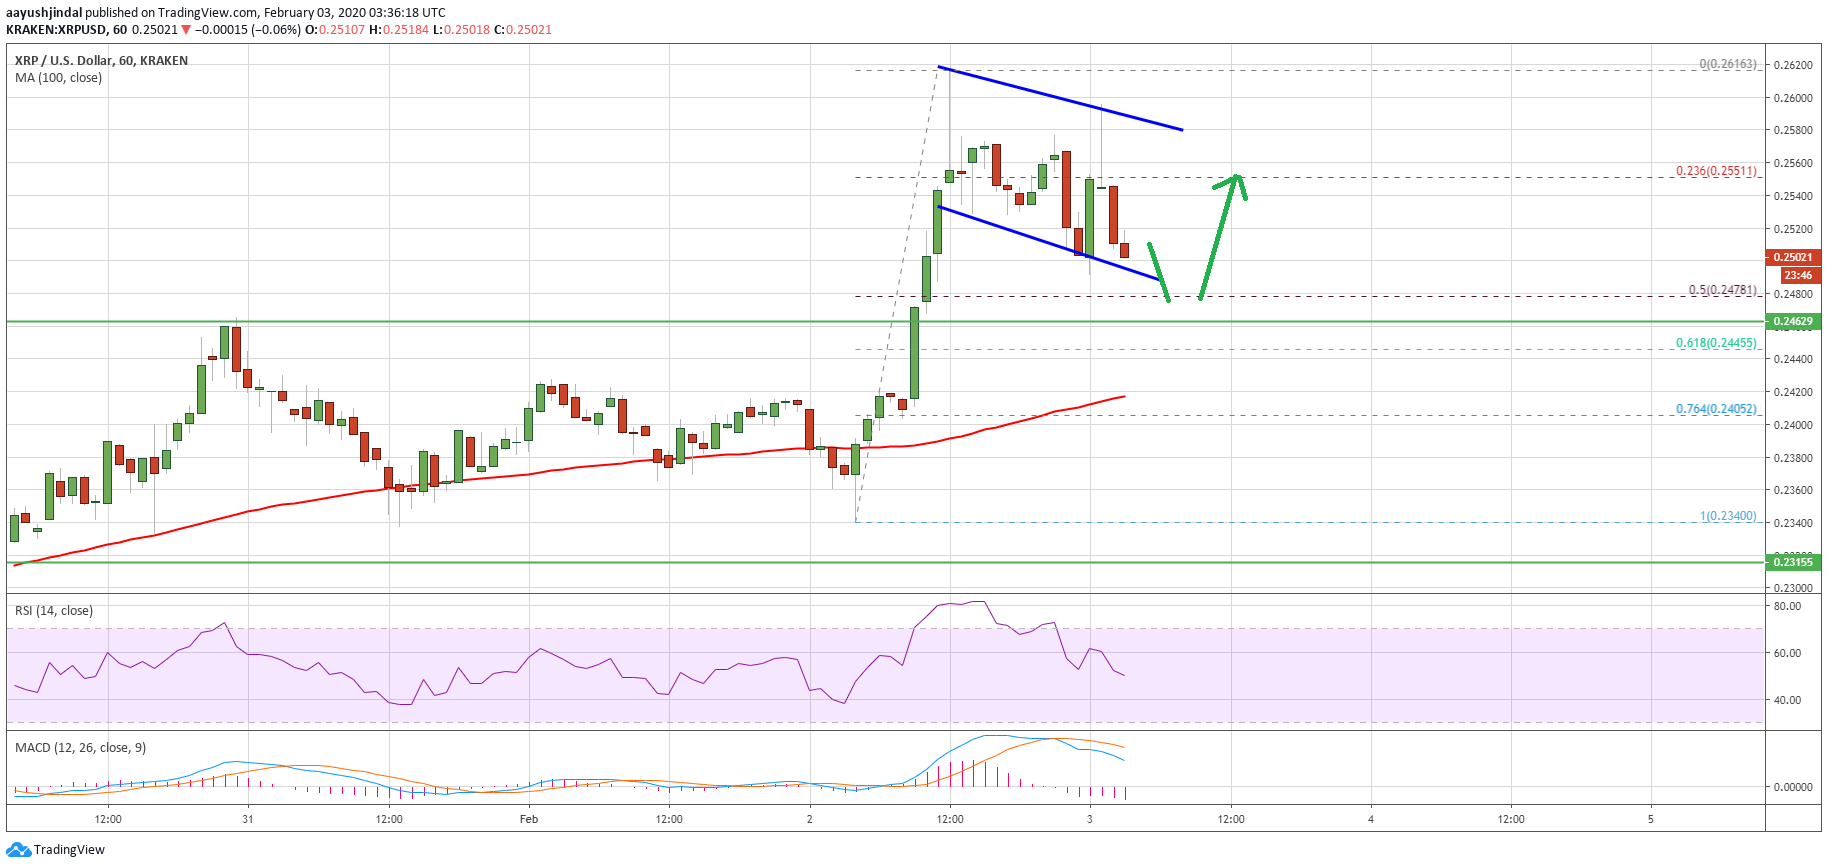
- There is a short term declining channel or a bullish flag forming with resistance near $0.2580 on the hourly chart of the XRP/USD pair (data source from Kraken).
- The pair is likely to continue higher towards $0.2750 and $0.3000 in the coming days.
Ripple Price Could Surge Again
After forming a support base near the $0.2320 level, ripple started a fresh increase. XRP price broke many hurdles near the $0.2450 and $0.2500 levels to enter a positive zone.
Moreover, the price settled nicely above $0.2450 and the 100 hourly simple moving average. Finally, the price traded to a new monthly high at $0.2616 and it is currently correcting lower.
It broke the 23.6% Fib retracement level of the recent wave from the $0.2340 low to $0.2616 high. Ripple is now approaching the $0.2500 support area, where the bulls are likely to emerge.
More importantly, there is a short term declining channel or a bullish flag forming with resistance near $0.2580 on the hourly chart of the XRP/USD pair. The 50% Fib retracement level of the recent wave from the $0.2340 low to $0.2616 high is also near the $0.2480 level.

On the upside, an immediate resistance is near the $0.2550 and $0.2580 levels. A successful break above $0.2580 might start another surge above the $0.2600 level.
In the mentioned case, the price is likely to climb higher towards the $0.2650 and $0.2750 levels. The main target for the bulls could be $0.3000 in the coming sessions.
Importance of $0.2450
The previous resistance for ripple near $0.2450 is now a major support area. If there is a downside break below $0.2450 support, there is a risk of a larger decline in the near term.
The next support is near the $0.2420 level and the 100 hourly simple moving average. If the price fails to stay above the 100 hourly simple moving average, it could continue to move down towards the $0.2320 support.
Technical Indicators
Hourly MACD – The MACD for XRP/USD is now slowly moving in the bearish zone.
Hourly RSI (Relative Strength Index) – The RSI for XRP/USD is currently just above the 50 level, with positive signs.
Major Support Levels – $0.2500, $0.2480 and $0.2450.
Major Resistance Levels – $0.2550, $0.2580 and $0.2650.


