
Reason to trust
How Our News is Made
Strict editorial policy that focuses on accuracy, relevance, and impartiality
Ad discliamer
Morbi pretium leo et nisl aliquam mollis. Quisque arcu lorem, ultricies quis pellentesque nec, ullamcorper eu odio.
Ethereum gained momentum and broke the key $170 resistance and bitcoin rallied above $9,000. ETH price seems to be forming a larger trend and it could even clear $180.
- There were decent bullish moves in Ethereum above the $165 and $170 levels against the US Dollar.
- The price is up around 4% and it is likely to climb towards the $180 resistance.
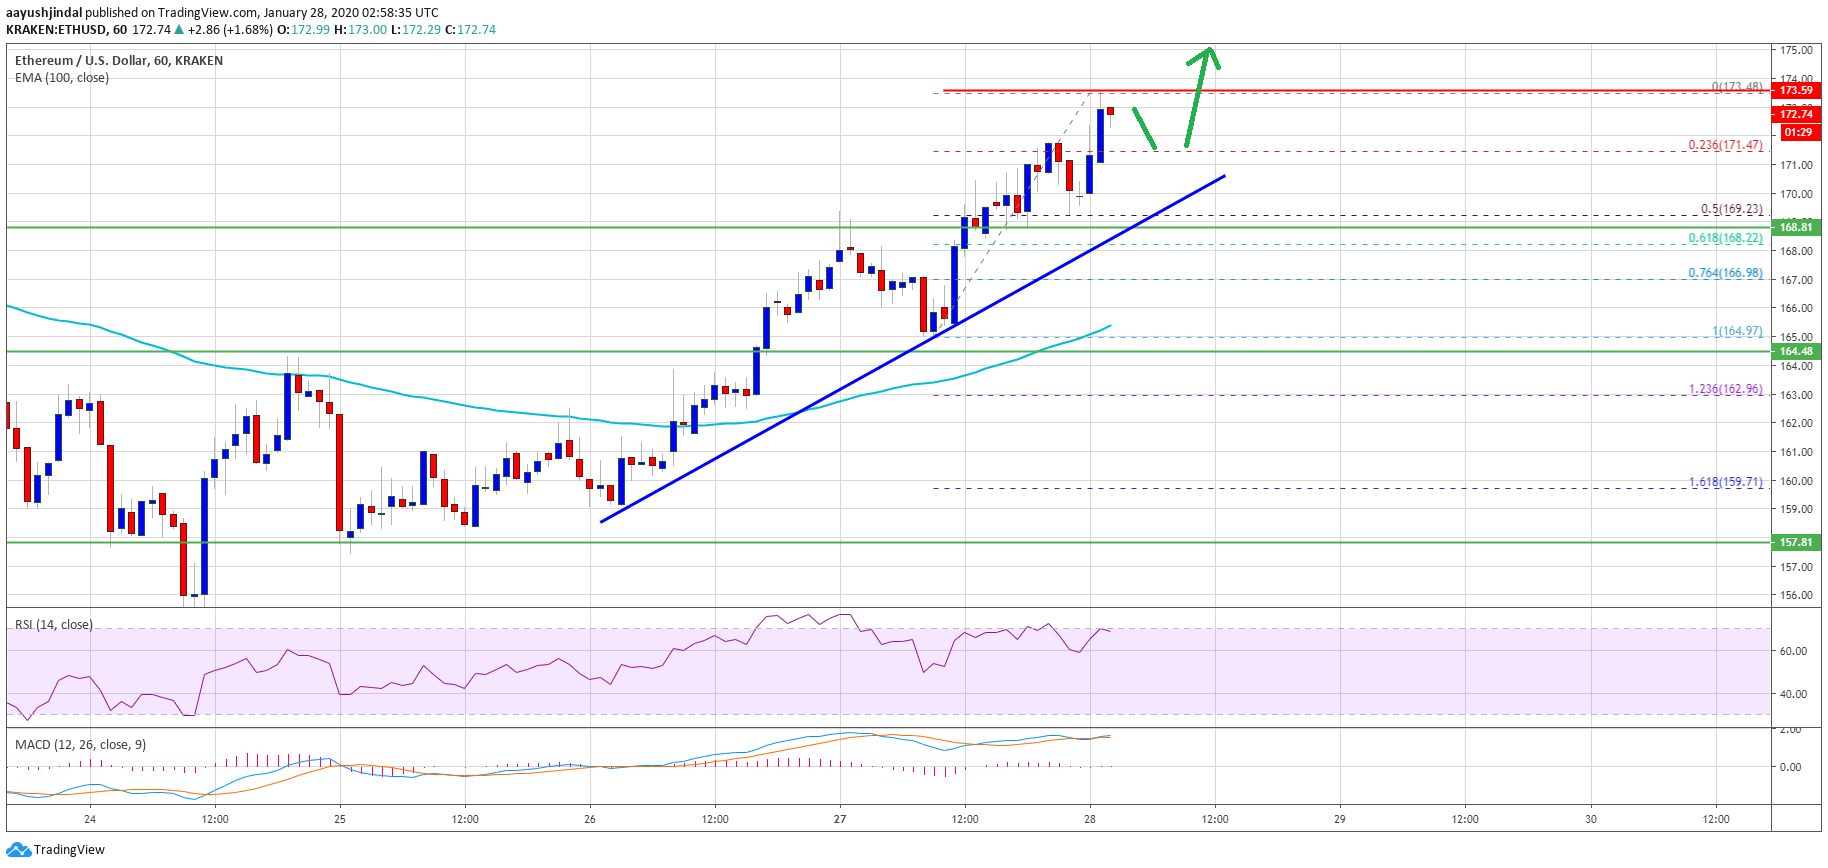
- There is a key bullish trend line forming with support near $170 on the hourly chart of ETH/USD (data feed via Kraken).
- There could be a larger rally once the price clears the $180 resistance area.
Ethereum Price Gaining Bullish Momentum
In the past few sessions, there were bullish moves in both bitcoin and Ethereum above $170 and $9,000 respectively against the US Dollar. ETH price settled above the $165 resistance area and the 100 hourly simple moving average.
A new weekly high is formed near the $174 level and the price is currently trading with a bullish angle. Besides, there is a key bullish trend line forming with support near $170 on the hourly chart of ETH/USD.
If there is a clear break above the $174 area, the bulls are likely to aim the $178 and $180 resistance levels.
More importantly, a clear break above the $180 resistance level could set the pace for a larger rally. In the mentioned case, the price is likely to surge towards the $200 level.
Any further gains could lead the price towards the $220 pivot level in the coming days. An intermediate resistance is near the $215 level.
Dips Remain Supported
In the short term, there could be a minor correction in ETH from $174 or $178. An initial support is near the $172 level or the 23.6% Fib retracement level of the recent upward move from the $165 swing low to $174 high.
The first major support on the downside is near the $170 level (the recent hurdle for the bulls). It is now near the bullish trend line and the 50% Fib retracement level of the recent upward move from the $165 swing low to $174 high.
If Ethereum extends its decline below the $170 support level, it could start a downside extension towards the $165 support. The 100 hourly SMA is also near the $165 level to provide support in the near term.
Technical Indicators
Hourly MACD – The MACD for ETH/USD is losing momentum in the bullish zone.
Hourly RSI – The RSI for ETH/USD is currently correcting lower towards the 60 level.
Major Support Level – $170
Major Resistance Level – $178