
Reason to trust
How Our News is Made
Strict editorial policy that focuses on accuracy, relevance, and impartiality
Ad discliamer
Morbi pretium leo et nisl aliquam mollis. Quisque arcu lorem, ultricies quis pellentesque nec, ullamcorper eu odio.
Ripple is currently recovering above $0.2325 against the US Dollar and bitcoin is trading above $8,700. XRP price is likely to surge towards $0.2500 or $0.2600 once it clears the $0.2400-$0.2420 resistance.
- Ripple price is showing a few positive signs above the $0.2320 area against the US dollar.
- The bulls seem to be facing a couple of hurdles near the $0.2400 and $0.2420 levels.
- Yesterday’s followed important bearish trend line is active with resistance near $0.2385 on the hourly chart of the XRP/USD pair (data source from Kraken).
- The pair is likely to start a strong rally if it settles above the $0.2400 resistance area.
Ripple Price To Continue Higher
After forming a support base above $0.2240 and $0.2260, ripple started a decent increase against the US Dollar. XRP price broke the $0.2320 resistance area and the 100 hourly simple moving average.
Furthermore, there was a break above the 23.6% Fib retracement level of the downward move from the $0.2540 high to $0.2240 swing low. However, the price faced a strong resistance near the $0.2400 area and it seems to be struggling to settle above the 100 hourly SMA.
More importantly, yesterday’s followed important bearish trend line is active with resistance near $0.2385 on the hourly chart of the XRP/USD pair.
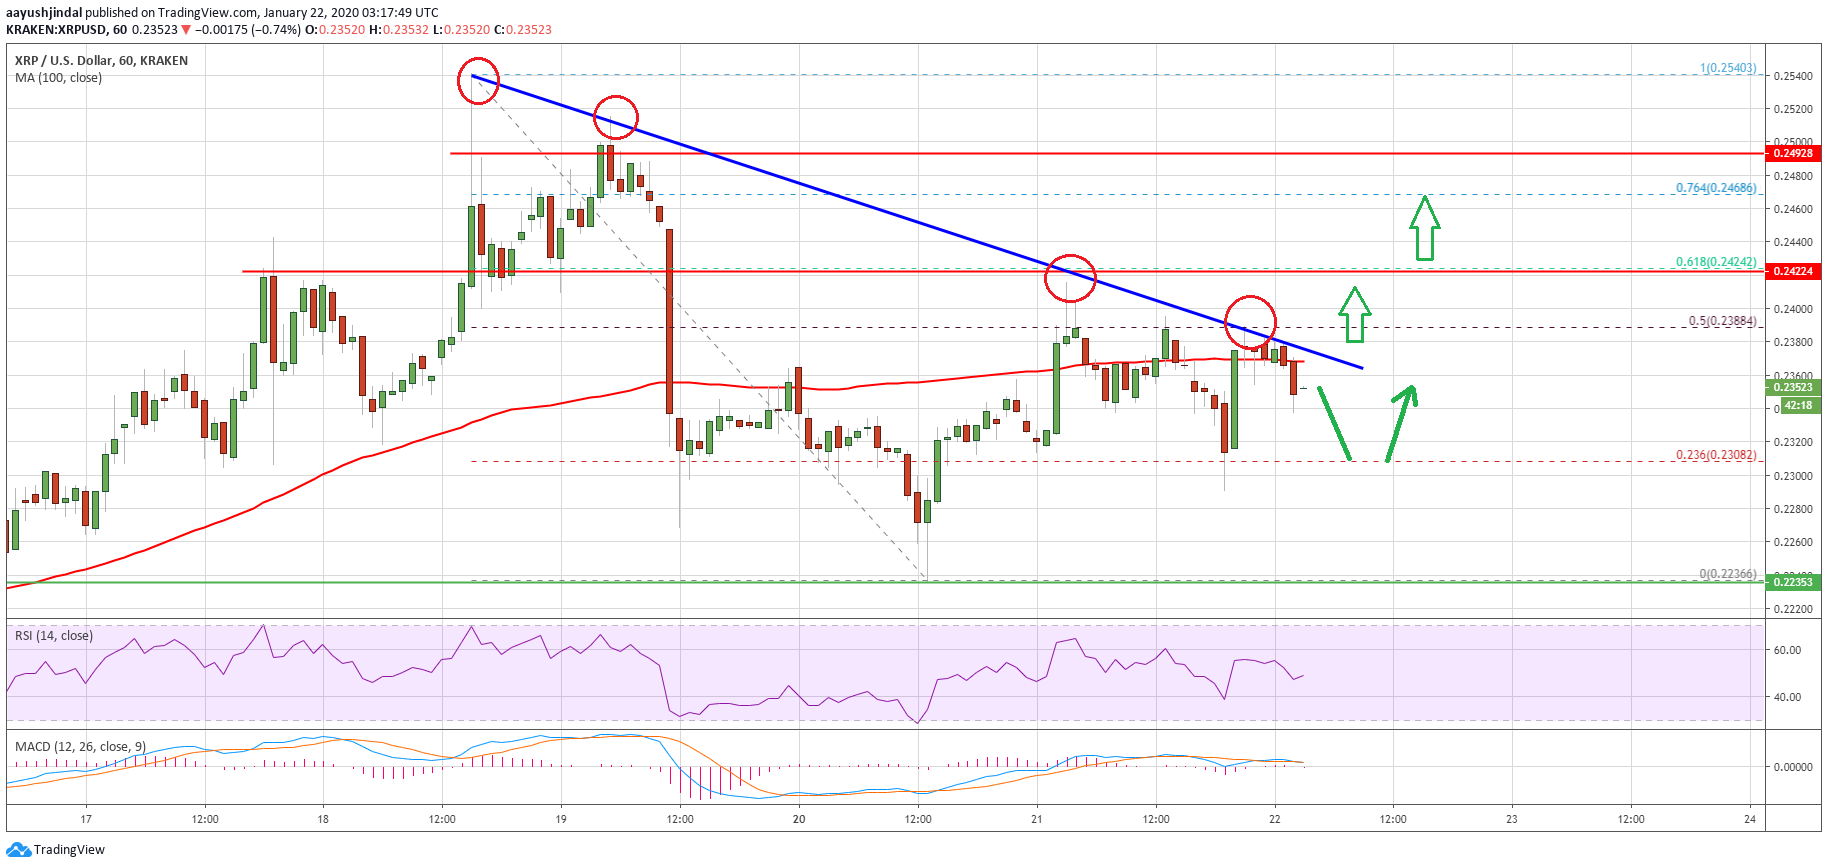
The trend line coincides with the 50% Fib retracement level of the downward move from the $0.2540 high to $0.2240 swing low. Therefore, ripple price must surpass the trend line and the $0.2400 resistance to continue higher in the near term.
A successful close above $0.2400 could start a strong rally and the price is likely to rise towards the $0.2500 and $0.2550 levels. Any further gains might lead the price towards the $0.2600 area.
What If XRP Fails Near $0.2400?
If XRP fails to continue above the $0.2400 resistance, it could resume its decline. The first major support on the downside is near the $0.2300 level (the neckline support).
If there is a clear break below the $0.2300 support, ripple could accelerate its decline towards the $0.2240 support zone in the coming sessions. Any further losses may perhaps call for a test of the $0.2120 support.
Technical Indicators
Hourly MACD – The MACD for XRP/USD is slowly losing momentum in the bullish zone.
Hourly RSI (Relative Strength Index) – The RSI for XRP/USD is currently struggling to stay above the 50 level.
Major Support Levels – $0.2300, $0.2240 and $0.2200.
Major Resistance Levels – $0.2385, $0.2400 and $0.2420.