
Reason to trust
How Our News is Made
Strict editorial policy that focuses on accuracy, relevance, and impartiality
Ad discliamer
Morbi pretium leo et nisl aliquam mollis. Quisque arcu lorem, ultricies quis pellentesque nec, ullamcorper eu odio.
Ethereum is trading nicely above the $162 and $158 support levels, similar to bitcoin above $8,500. ETH price is likely forming an inverse head and shoulders pattern, suggesting a fresh increase.
- Ether price is currently consolidating above the $162 support area against the US Dollar.
- Bitcoin price is finding a strong buying interest above the $8,500 support area.
- There is a key bearish trend line forming with resistance near $170 on the hourly chart of ETH/USD (data feed via Kraken).
- The pair could rally if it clears the $168 and $170 resistance levels in the near term.
Ethereum Forming Bullish Breakout Pattern
Recently, we saw a downside correction in Ethereum from the $180 resistance area against the US Dollar. ETH price corrected lower below the $170 and $166 support levels.
Moreover, there was a close below the $170 level and the 100 hourly simple moving average. Finally, there was a spike below the $162 support, but the $160 area acted as a strong buy zone.
A swing low is formed near $160 and the price is currently recovering. Ethereum climbed above the 23.6% Fib retracement level of the recent drop from the $179 high to $160 low.
At the outset, it seems like the price is forming an inverse head and shoulders pattern with resistance near the $170 area. Besides, there is a key bearish trend line forming with resistance near $170 on the hourly chart of ETH/USD.
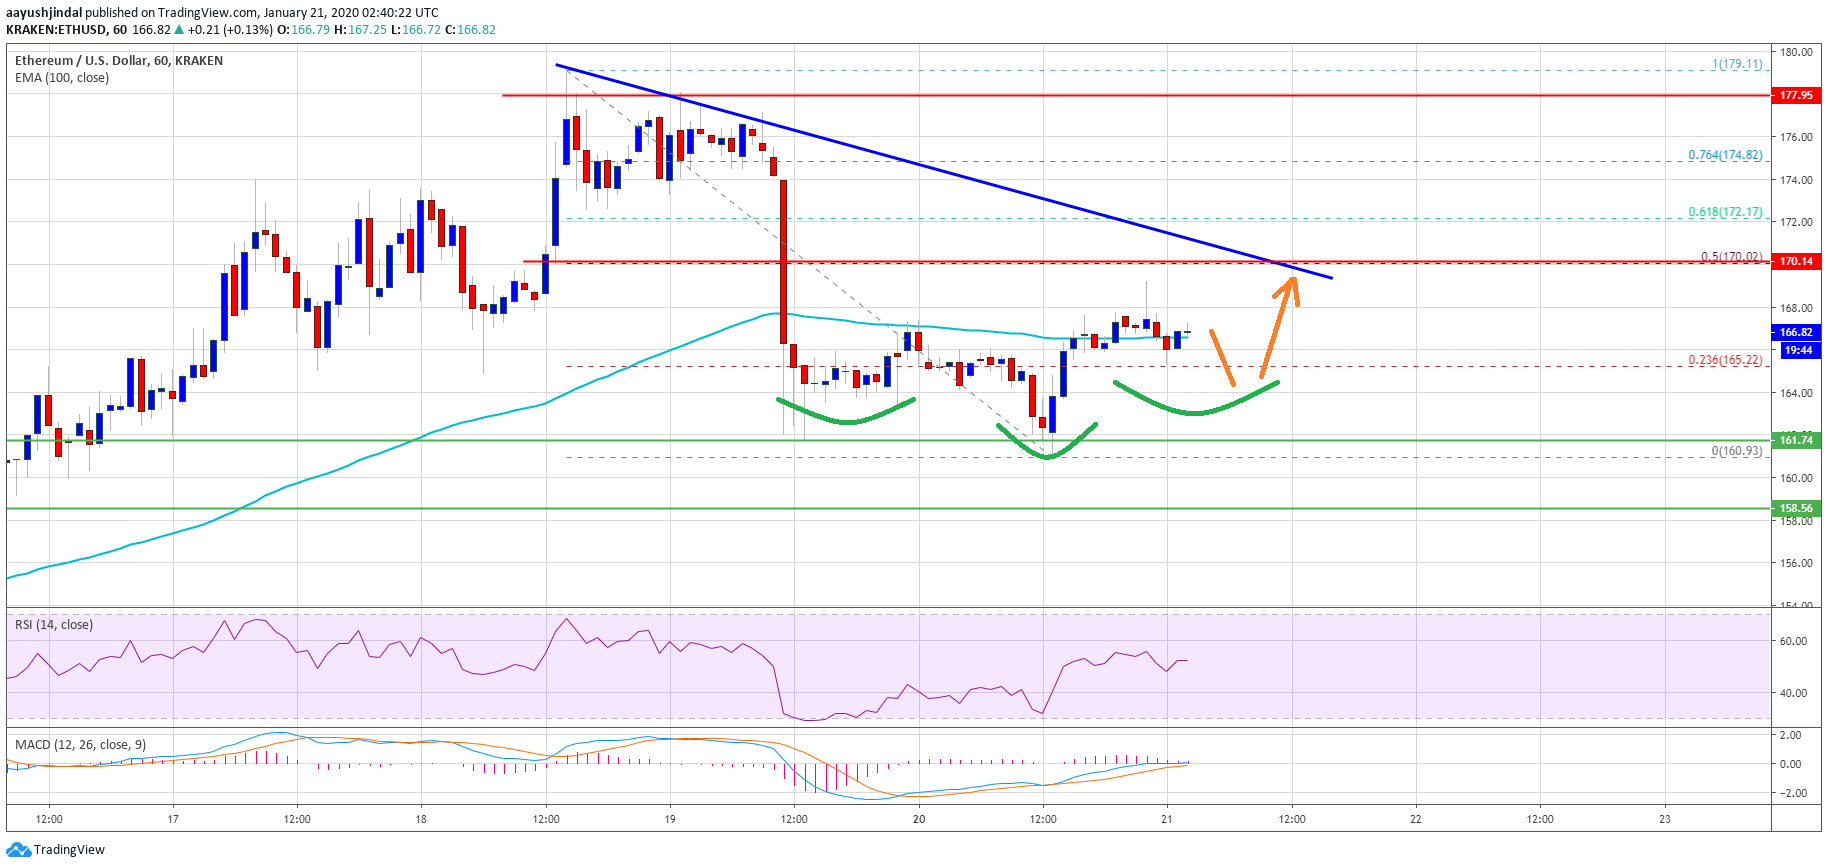
The 50% Fib retracement level of the recent drop from the $179 high to $160 low is also near $170. Therefore, a successful close above the $170 resistance area is needed for a fresh increase towards the $178 and $180 resistance levels. Any further gains could lead the price towards the $200 area.
Pattern Invalidation For ETH
On the downside, the main support for the possible inverse head and shoulders pattern is near the $162 area. If there is a bearish close below the $162 support, the price is likely to invalidate the highlighted inverse head and shoulders pattern.
The next key supports are near the $160 and $158 levels. If Ethereum fails to stay above the $158 support, there is a risk of a larger decline in the near term. In the mentioned case, the price is likely to decline towards the $150 and $148 levels.
Technical Indicators
Hourly MACD – The MACD for ETH/USD is struggling to gain momentum in the bullish zone.
Hourly RSI – The RSI for ETH/USD is currently above the 50 level, with a positive angle.
Major Support Level – $160
Major Resistance Level – $170