
Reason to trust
How Our News is Made
Strict editorial policy that focuses on accuracy, relevance, and impartiality
Ad discliamer
Morbi pretium leo et nisl aliquam mollis. Quisque arcu lorem, ultricies quis pellentesque nec, ullamcorper eu odio.
Bitcoin corrected lower below $8,700, but it found a strong support above $8,500 against the US Dollar. BTC price is currently rising and it could rally if it clears the $8,840-$8,900 resistance area.
- Bitcoin price might not go down quietly and it could rally above $8,800 against the US Dollar.
- The double top pattern is still valid unless the bulls clear the $8,900 resistance.
- There is a new breakout pattern forming with resistance near $8,825 on the hourly chart of the BTC/USD pair (data feed from Kraken).
- The main supports on the downside are near $8,580 and $8,500.
Bitcoin Bears Struggle To Gain Traction
Yesterday, we saw a downside correction in bitcoin after it was rejected near the $8,900 resistance against the US Dollar. BTC price declined below the $8,700 support level, but the bulls defended the $8,540 and $8,500 levels.
The bears made many attempts to break the neckline support of the double top pattern at $8,540, but they failed. As a result, the price started a decent increase and traded above the $8,700 resistance.
Moreover, bitcoin climbed above the 50% Fib retracement level of the recent decline from the $8,866 high to $8,578 low. It is now approaching the $8,800 and $8,820 resistance levels.
The 76.4% Fib retracement level of the recent decline from the $8,866 high to $8,578 low is also near $8,800. More importantly, there is a new breakout pattern forming with resistance near $8,825 on the hourly chart of the BTC/USD pair.
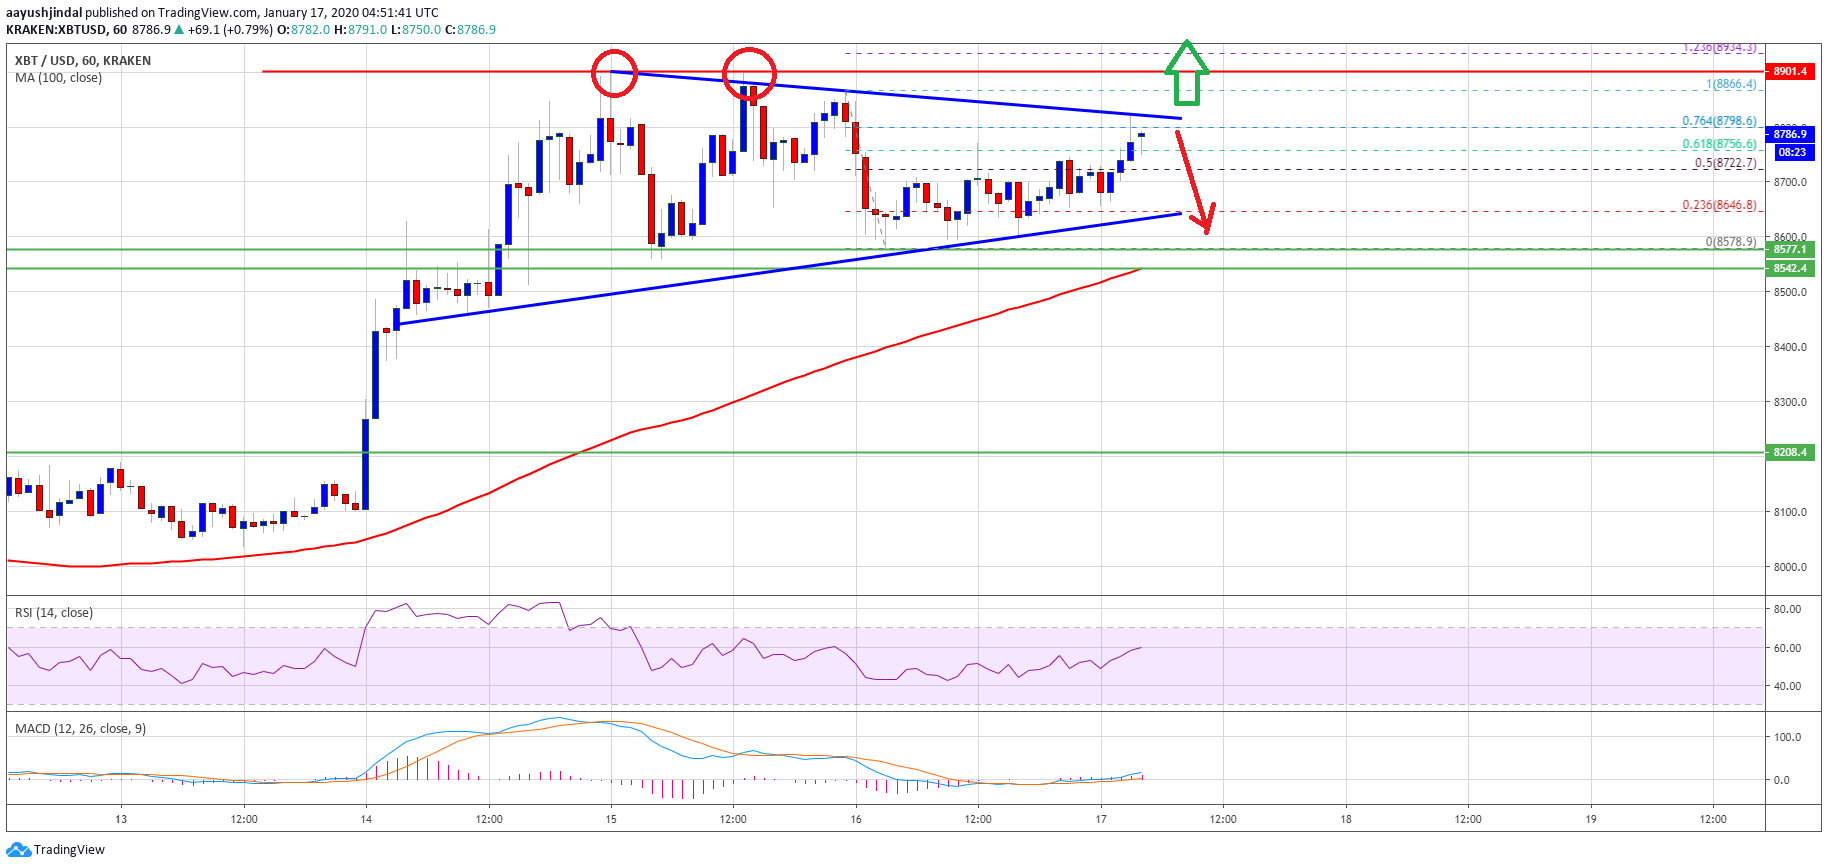
If the bulls manage to push the price above the triangle resistance and $8,840, there are high chances of more upsides above the $8,900 resistance. In the mentioned case, the double top pattern is likely to invalidate and the price might rally above $9,000 in the near term.
What If BTC Stays Below $8,900
If BTC price fails to climb above the triangle resistance and $8,840, it is likely to move down. The first key support is near the triangle at $8,640.
If there is a downside break, the bears may perhaps aim a clear break below the key $8,540 and $8,500 support levels. If they succeed, the price is likely to decline towards $8,200.
Overall, bitcoin bulls are giving a tough fight and it seems like a breakdown below the $8,540 and $8,500 support levels won’t be easy.
Technical indicators:
Hourly MACD – The MACD is now gaining momentum in the bullish zone.
Hourly RSI (Relative Strength Index) – The RSI for BTC/USD is back above the 50 level.
Major Support Levels – $8,640 followed by $8,540.
Major Resistance Levels – $8,825, $8,840 and $8,900.