
Reason to trust
How Our News is Made
Strict editorial policy that focuses on accuracy, relevance, and impartiality
Ad discliamer
Morbi pretium leo et nisl aliquam mollis. Quisque arcu lorem, ultricies quis pellentesque nec, ullamcorper eu odio.
Ethereum rallied towards $170 and bitcoin jumped towards $9,000 before starting a downside correction. However, dips in ETH price remains supported near $158 and $155.
- Ether price started a downside correction the new 2020 high at $172 against the US Dollar.
- The price is currently trading below $165 and it could extend its decline.
- There is a major declining channel forming with resistance near $165 on the hourly chart of ETH/USD (data feed via Kraken).
- The pair could test the key $155 support area before it starts a fresh increase in the near term.
Ethereum Starts Downside Correction
Yesterday, we saw a strong rise in Ethereum above the $160 resistance and bitcoin above $8,500 against the US Dollar. ETH price traded to a new 2020 high near $172 before it faced a strong selling interest.
Later, there was a downside correction and the price declined below the $165 support. Moreover, there was a break below the 23.6% Fib retracement level of the upward move from the $143 swing low to $172 high.
The price even broke the $162 support and tested the $160 region. An initial support on the downside is near the $158 level. It coincides with the 50% Fib retracement level of the upward move from the $143 swing low to $172 high.
More importantly, there is a major declining channel forming with resistance near $165 on the hourly chart of ETH/USD. Therefore, there are chances that Ethereum might follow the declining channel and slide towards the $158 and $155 support levels.
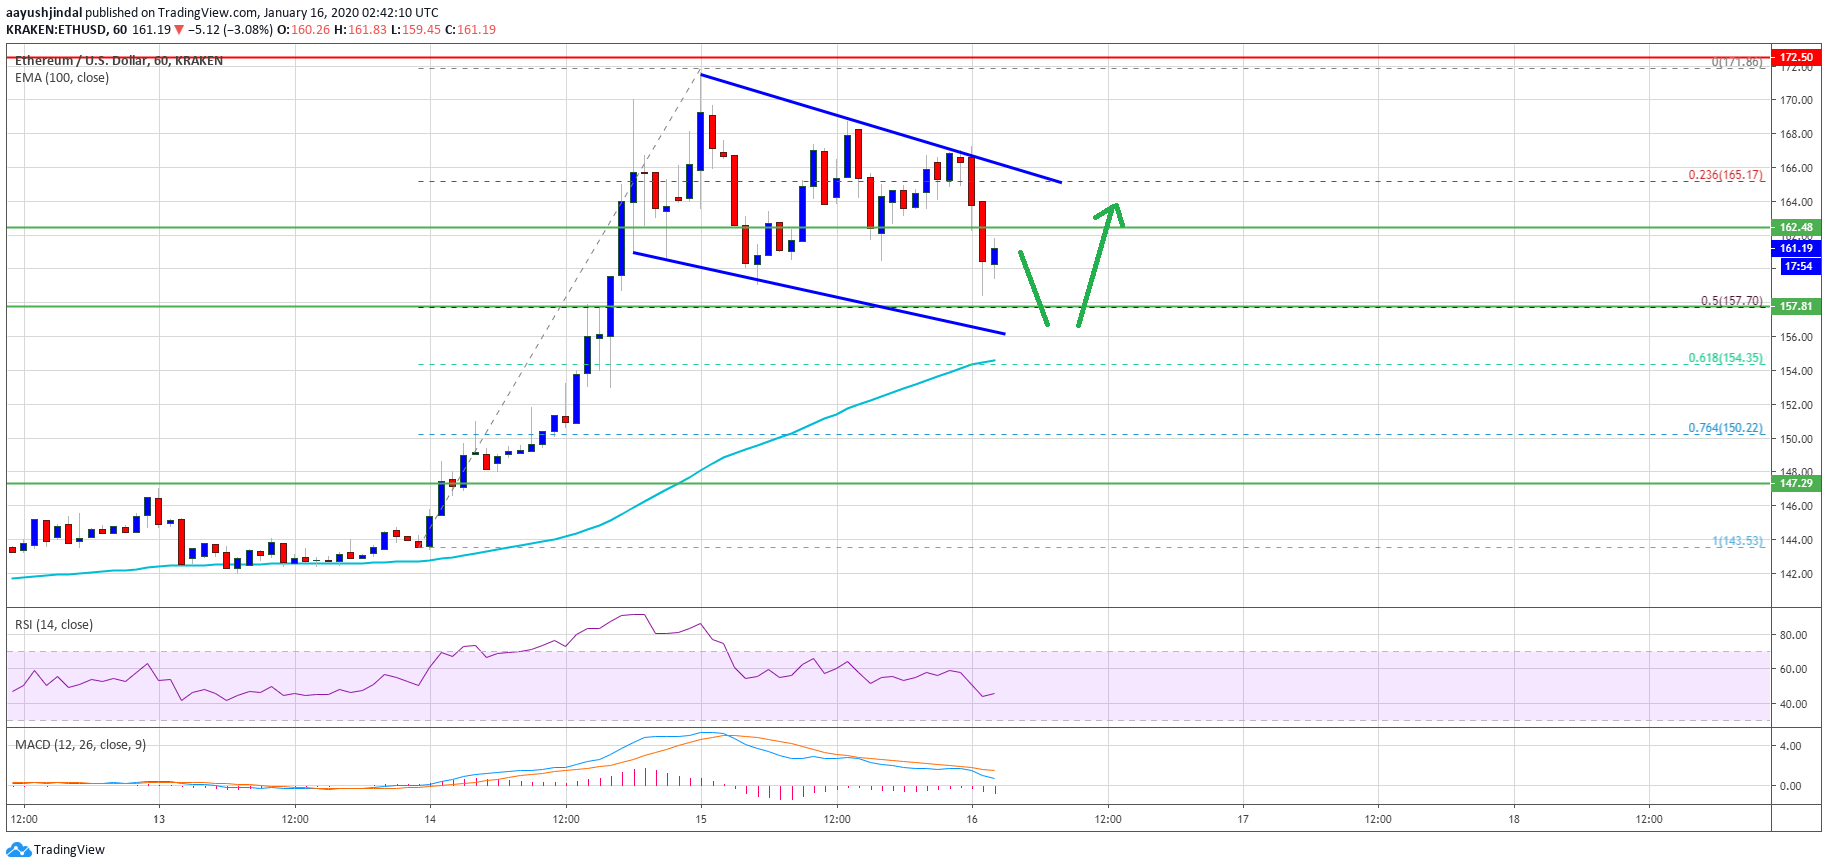
The main support is now near $155 and the 100 hourly simple moving average. Besides, the 61.8% Fib retracement level of the upward move from the $143 swing low to $172 high is near $155.
Fresh Increase In ETH?
As mentioned, the $155 area is a crucial support. As long as ETH price is above the $155 level, the bulls are likely to remain in action. On the upside, an initial resistance is near the $164 level.
The main resistance is near the $165 zone and the channel upper trend line. A clear break above the channel resistance is likely to set the pace for more gains in the coming sessions. The next hurdles are near $170-$172, above which Ethereum is likely to climb towards the $180 zone.
Technical Indicators
Hourly MACD – The MACD for ETH/USD is slowly gaining momentum in the bearish zone.
Hourly RSI – The RSI for ETH/USD is currently below the 50 level, with a few negative signs.
Major Support Level – $155
Major Resistance Level – $165