Reason to trust

How Our News is Made
Strict editorial policy that focuses on accuracy, relevance, and impartiality
Ad discliamer
Morbi pretium leo et nisl aliquam mollis. Quisque arcu lorem, ultricies quis pellentesque nec, ullamcorper eu odio.
If you’ve spent any time browsing crypto Twitter, or any of the Bitcoin or crypto-focused communities on Reddit, there’s no doubt you’ve come across investors challenging traders sharing charts filled with trendlines, saying that “technical analysis doesn’t work.”
While technical analysis does not guarantee success, it can certainly increase the probability of it. However, any bias – something that is ever-present throughout the crypto market – must be removed to accurately get a read on the market. Let’s take a look at how bias can interfere with technical analysis, and why many believe the practice doesn’t work at all.
Crypto Technical Analysis Isn’t About Perfection, It’s About Probabilities
Bitcoin price has exploded out from its recent low trading range between $6,400 and $7,400 and made its way toward a local high of $8,900.
The leading cryptocurrency by market cap has since been consolidating and before the day is over is likely to choose the direction it’s going to go on for the weeks ahead.
Related Reading | Comparing Current Bitcoin Breakout To Historic October China Rally
But the most recent price action can be confusing, as cryptocurrency trader Jacob Canfield points out. Because the market is comprised of both bearish and bullish selling or buying pressure, oftentimes price patterns can appear to be both bearish and bullish, and if a trader or analyst holds any bias, there’s a strong chance their judgment will be clouded.
In an example shared by the prominent trader, the same chart is shown with two different chart patterns drawn out with trendlines. One appears to be a bull flag pattern, which typically signals bullish continuation. The other pattern could be a triangle or pennant that has started to break down.
https://twitter.com/jacobcanfield/status/1217662705492021249?s=12
The above serves as a perfect example of why technical analysis isn’t perfect and is regularly challenged by those that do not practice it.
Even Bitcoin’s Downtrend Line Changes With Personal Bias
How trendlines are drawn, and by whom can reshape the same structures across the same price chart, especially if there is bias thrown in the mix.
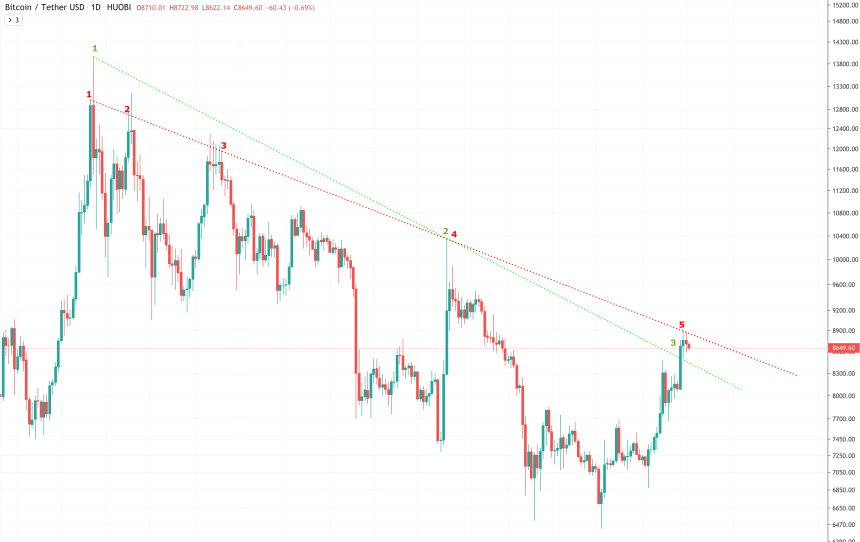
Take Bitcoin’s downtrend line for example. Trendlines should be drawn with the most possible touches, however, bias can easily cause an analyst to miss this important point, and draw the line across the most obvious points.

In the above example, the green “bullish” downtrend line has only been touched twice, and Bitcoin has now broken out from the trendline on the third try, suggesting the downtrend is over.
Related Reading | Bulls Beware: Last Bitcoin Downtrend Breakout Led To Bear Market Lows
However, the red trendline has multiple touches and hasn’t been breached above by Bitcoin with this recent rally, suggesting the downtrend isn’t over at all.
So, for those of you new to technical analysis or don’t understand it, it does work, but it requires a clear view of the market, without any bias. For those that are regularly practicing technical analysis and failing to find success, try removing any personal bias from your charts, and see if your win rate improves.


