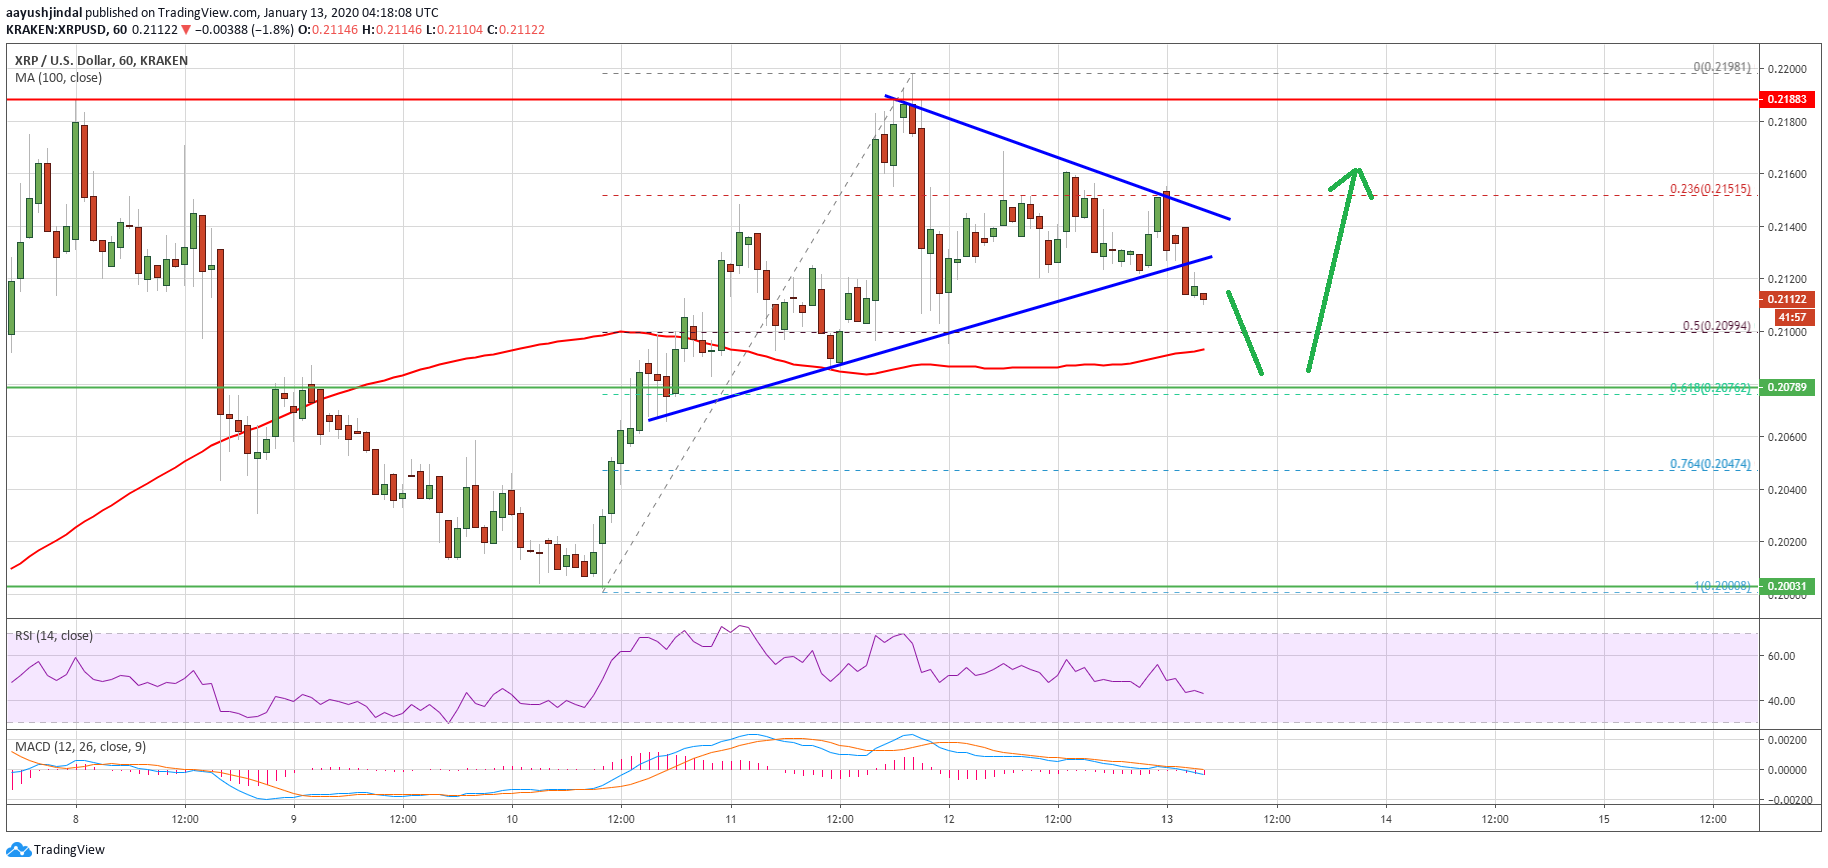
Ripple is facing hurdles near the $0.2200 resistance against the US Dollar, similar to bitcoin near $8,200. XRP price is declining, but the bulls are likely to protect $0.2080 and $0.2070.
- Ripple price is correcting lower after it failed to surpass the $0.2200 resistance against the US dollar.
- The price remains well supported on the downside near the $0.2080 and $0.2070 levels.
- Recently, there was a break below a connecting bullish trend line with support at $0.2125 on the hourly chart of the XRP/USD pair (data source from Kraken).
- The pair could dip towards the $0.2080 support before it bounces back above $0.2125 and $0.2150.
Ripple Price Remains Supported
After forming a support base near $0.2000, ripple started a steady rise above $0.2100 against the US Dollar. Both bitcoin and Ethereum climbed higher, which helped XRP in climbing towards the $0.2200 resistance area.
However, the bulls failed to push the price above the $0.2200 resistance area. A high was formed near $0.2198 before the price started a downside correction. It broke the $0.2160 and $0.2150 support levels.
Besides, there was a break below a connecting bullish trend line with support at $0.2125 on the hourly chart of the XRP/USD pair. Ripple price is now trading below the 23.6% Fib retracement level of the upward move from the $0.2003 low to $0.2198 high.

On the downside, there are many supports, starting with $0.2100. It represents the 50% Fib retracement level of the upward move from the $0.2003 low to $0.2198 high.
The next key supports are near $0.2080, $0.2070, and the 100 hourly simple moving average. Therefore, XRP is likely to find a strong buying interest if it dips towards the $0.2080 area in the near term.
If there is a downside break and close below $0.2070, it could invalidate the bullish view and ripple is likely to dive towards the $0.2000 support.
Hurdles On The Upside For XRP
The first resistance for XRP is near the $0.2125 area, above which the price is likely to rise above the $0.2150 resistance area. The main resistance is near the $0.2200 level. A successful daily close above the $0.2200 resistance may perhaps open the doors for a fresh rally towards the $0.2320 level.
Looking at the chart, ripple price is correcting lower, but the bulls are still active above $0.2080 and $0.2070. Only a close below $0.2070 might decrease the chances of a break above $0.2200 in the coming sessions.
Technical Indicators
Hourly MACD – The MACD for XRP/USD is slowly moving into the bearish zone.
Hourly RSI (Relative Strength Index) – The RSI for XRP/USD is now well below the 50 level.
Major Support Levels – $0.2100, $0.2080 and $0.2070.
Major Resistance Levels – $0.2125, $0.2150 and $0.2200.


