
Reason to trust
How Our News is Made
Strict editorial policy that focuses on accuracy, relevance, and impartiality
Ad discliamer
Morbi pretium leo et nisl aliquam mollis. Quisque arcu lorem, ultricies quis pellentesque nec, ullamcorper eu odio.
Bitcoin price is confined in a range below the key $8,200 resistance against the US Dollar, suggesting a short term accumulation phase. BTC could either rally above $8,200 or it might dip to $7,700 before a decent bounce.
- Bitcoin is moving in a range between $8,200 and $8,000 against the US Dollar.
- The bulls are likely aiming an upside break above the $8,200 resistance area.
- There is a key bearish trend line forming with resistance near $8,170 on the hourly chart of the BTC/USD pair (data feed from Kraken).
- The pair could rally if there is a clear break above $8,200 and $8,250 in the next 2-3 sessions.
Bitcoin Eyes Upside Break
Despite all hurdles, bitcoin bullish were able to push the price above the $8,000 level against the US Dollar. BTC price even settled above the 100 hourly simple moving average, but it is struggling to clear the $8,200 resistance.
Looking at the chart below, the price climbed nicely from the $7,668 swing low. It broke the $8,100 resistance and the 100 hourly simple moving average. A high was formed near $8,319 before the price started consolidating in a range.
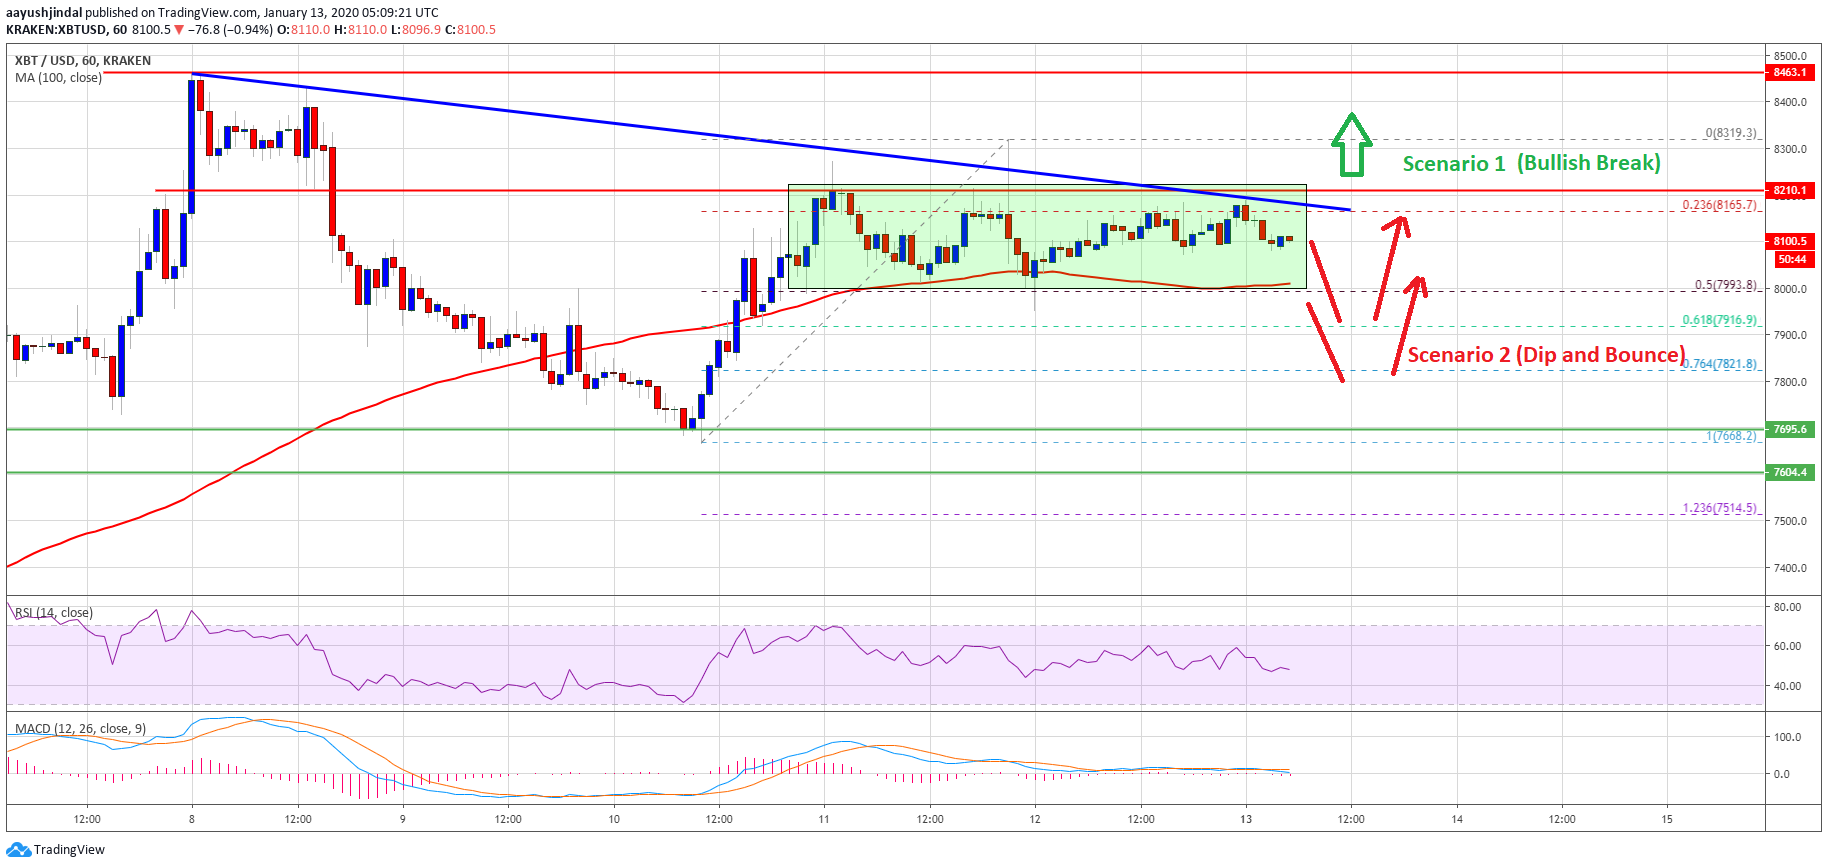
It seems like bitcoin is in a short term accumulation phase and consolidating below the key $8,200 and $8,250 resistance levels. Besides, there is a key bearish trend line forming with resistance near $8,170 on the same chart of the BTC/USD pair.
On the upside, a clear break above the $8,200 resistance could trigger a nice rally. The next key hurdle is near the $8,460, above which the bulls are likely to aim a break of $8,500.
Chances of Short Term Pullbacks In BTC
Conversely, there are chances of a short term downside break below the range support at $8,000. Besides, the 100 hourly simple moving average is near $8,000 and the 50% Fib retracement level of the upward move from the $7,668 low to $8,319 high.
If there is a downside break below $8,000, the price may perhaps dip towards the $7,700 support area. An intermediate support is near $7,820 and the 76.4% Fib retracement level of the upward move from the $7,668 low to $8,319 high.
The main support for bitcoin is near the $7,600 area. The main support for bitcoin is near the $7,600 area. If there is a daily close below $7,600 and $7,500, it could negate the current bullish bias.
Technical indicators:
Hourly MACD – The MACD is slowly moving into the bearish zone.
Hourly RSI (Relative Strength Index) – The RSI for BTC/USD is currently declining below the 50 level.
Major Support Levels – $8,000 followed by $7,820.
Major Resistance Levels – $8,170, $8,200 and $8,250.


