
Reason to trust
How Our News is Made
Strict editorial policy that focuses on accuracy, relevance, and impartiality
Ad discliamer
Morbi pretium leo et nisl aliquam mollis. Quisque arcu lorem, ultricies quis pellentesque nec, ullamcorper eu odio.
Ethereum extended its decline below the $140 support versus the US Dollar, while bitcoin dived below $8,000. ETH bulls must protect the $135 support to start a decent recovery.
- Ether price failed to recover and declined further below $140 against the US Dollar.
- The price is currently approaching the main $135 support and pivot area.
- There is a new connecting bearish trend line forming with resistance near $138 on the hourly chart of ETH/USD (data feed via Kraken).
- The pair could decline heavily if it fails to stay above the $135 and $132 support levels.
Ethereum Price Turns Red
Recently, Ethereum started a downside correction below the $142 support against the US Dollar. However, it seems like there are bearish signs emerging after ETH failed to stay above the $140 support.
Similarly, bitcoin is gaining bearish momentum and now trading well below $8,000. Ripple price is also diving and it is now at a risk of a break below the $0.2000 support area.
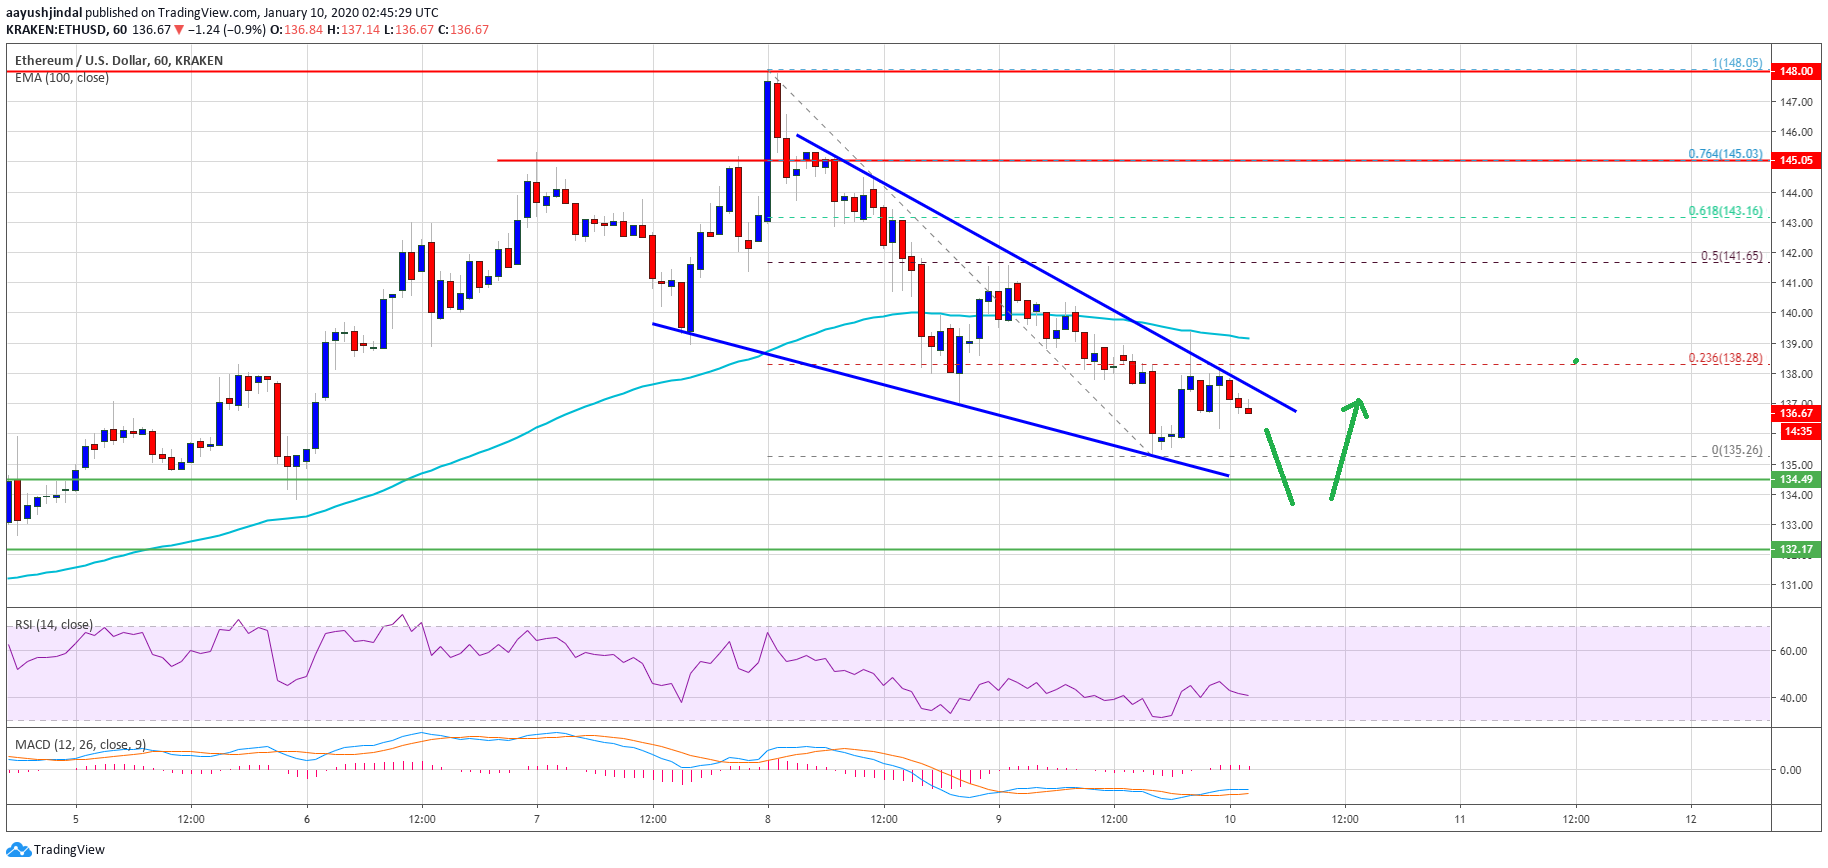
The recent decline in Ethereum took its price towards the $135 support area. The price also settled below the $140 level and the 100 hourly simple moving average. A low is formed near $135 and the price is currently consolidating losses.
An initial resistance is near the $138 level. Besides, the 23.6% Fib retracement level of the recent slide from the $148 high to $135 low is also near $138.
More importantly, there is a new connecting bearish trend line forming with resistance near $138 on the hourly chart of ETH/USD. To start a decent recovery, Ethereum must surpass the trend line, $140, and the 100 hourly SMA.
The next resistance could be near the $142 level. It is close to the 50% Fib retracement level of the recent slide from the $148 high to $135 low. Therefore, a successful close above the $142 level might start a new uptrend and the price could continue higher towards $148 and $150.
What If ETH Fails to Stay Above $135?
On the downside, the $135 area is a crucial support for ETH. Therefore, a bearish breakdown below the $135 support could start a strong downtrend below $132 and $130 in the near term.
Looking at the chart, Ethereum price is approaching the main $135 support. It might attempt a decent recovery above $142 and $145. If not, it could dive further and revisit the $125 zone.
Technical Indicators
Hourly MACD – The MACD for ETH/USD is not showing any positive signs.
Hourly RSI – The RSI for ETH/USD is now below the 50 level, with a bearish angle.
Major Support Level – $135
Major Resistance Level – $142