
Reason to trust
How Our News is Made
Strict editorial policy that focuses on accuracy, relevance, and impartiality
Ad discliamer
Morbi pretium leo et nisl aliquam mollis. Quisque arcu lorem, ultricies quis pellentesque nec, ullamcorper eu odio.
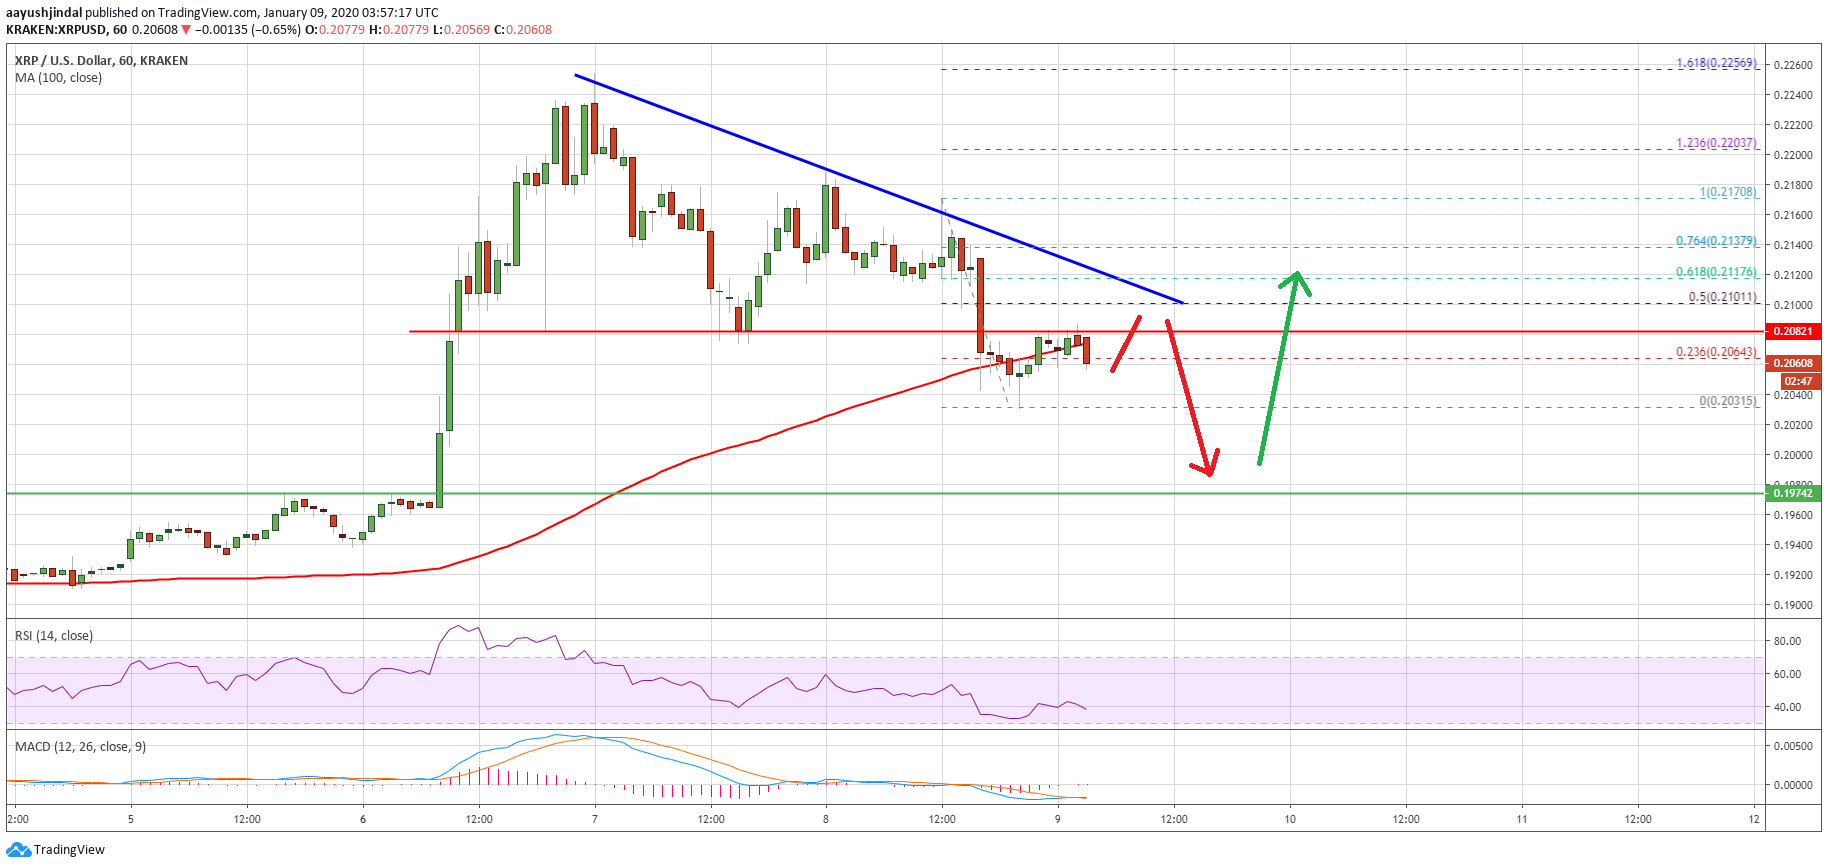
Ripple was rejected near the $0.2250 resistance area against the US Dollar, similar to bitcoin near $8,450. As a result, there was a downside correction in XRP below $0.2150 and $0.2100.
- Ripple price is down more than 10% and it is now trading below $0.2100 against the US dollar.
- The price even failed to stay above the key $0.2080 support area.
- There is a major bearish trend line forming with resistance near $0.2105 on the hourly chart of the XRP/USD pair (data source from Kraken).
- There are chances of more losses unless the price climbs above $0.2100 and $0.2100.
Ripple Price Facing Hurdles
After a strong increase, ripple failed to surpass the $0.2250 resistance area against the US Dollar. There was a sharp bearish reaction in XRP and the price declined below the $0.2150 support.
Moreover, there was a break below the $0.2100 support and the 100 hourly simple moving average. The bulls even failed to protect the $0.2080 support and the price traded as low as $0.2031.
A similar price action was observed for bitcoin after it was rejected near the $8,450 level. BTC is down 5% and it broke the $8,080 support area.
Looking at ripple, it is currently correcting higher after trading as low as $0.2031. It recovered above the 23.6% Fib retracement level of the recent decline from the $0.2170 high to $0.2031 low.
However, the previous support near $0.2080 is now acting as a hurdle. More importantly, there is a major bearish trend line forming with resistance near $0.2105 on the hourly chart of the XRP/USD pair.
The 50% Fib retracement level of the recent decline from the $0.2170 high to $0.2031 low is also near the $0.2100 level to prevent an upside break. Therefore, ripple needs to climb above $0.2080, $0.2100 and $0.2120 to start a fresh increase.
One Final Push In XRP To $0.2000?
The current price action suggests that XRP might be setting up for a final downside thrust below the $0.2050 level. In the mentioned scenario, the price might spike towards $0.2000 or $0.1980 before it starts a new upward move.
Looking at the chart, ripple price is clearly broke a couple of important supports to invalidate the chances of a run towards $0.2400. Still, the price is likely to bounce back until there is no daily close below $0.2000.
Technical Indicators
Hourly MACD – The MACD for XRP/USD is about to move into the bullish zone.
Hourly RSI (Relative Strength Index) – The RSI for XRP/USD is now well below the 50 level.
Major Support Levels – $0.2050, $0.2000 and $0.1980.
Major Resistance Levels – $0.2080, $0.2100 and $0.2120.


