
Reason to trust
How Our News is Made
Strict editorial policy that focuses on accuracy, relevance, and impartiality
Ad discliamer
Morbi pretium leo et nisl aliquam mollis. Quisque arcu lorem, ultricies quis pellentesque nec, ullamcorper eu odio.
Ripple is grinding higher above $0.1950 against the US Dollar, whereas bitcoin and Ethereum surpassed key hurdles. Therefore, XRP price is likely to climb above $0.2000 and $0.2100.
- Ripple price is showing positive signs above the $0.1920 resistance against the US dollar.
- Bitcoin rallied above $7,500, opening the doors for more gains in the near term.
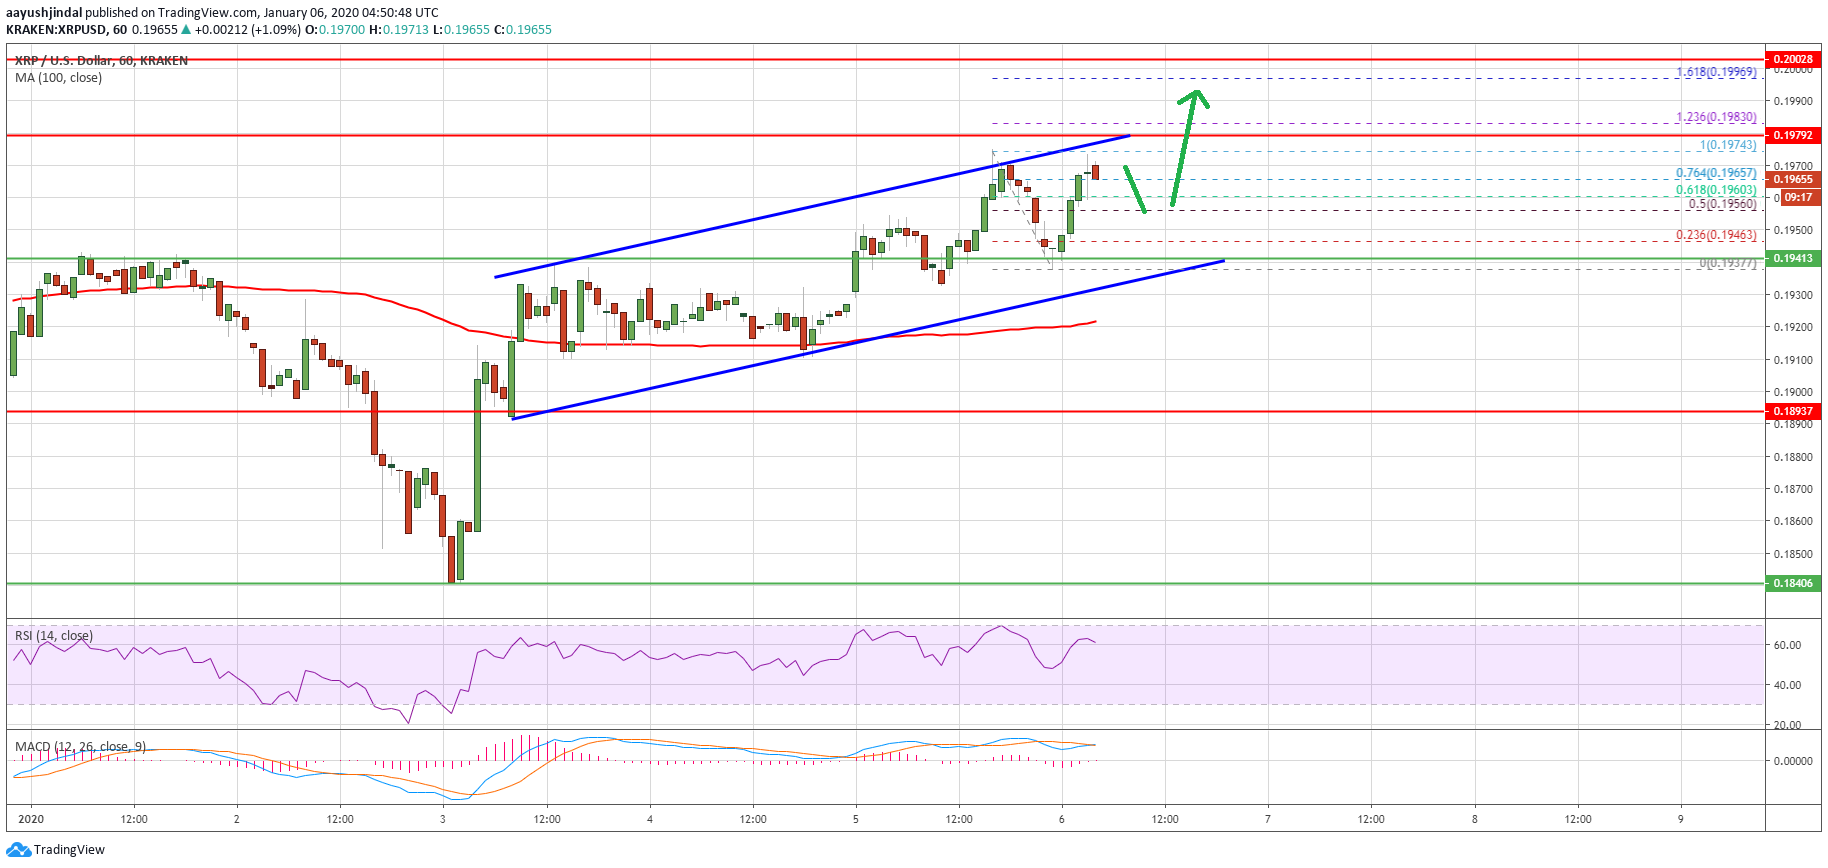
- There is a key rising channel forming with support near $0.1940 on the hourly chart of the XRP/USD pair (data source from Kraken).
- There are high chances of a crucial upside break above the $0.2000 resistance area.
Ripple Price Could Surpass $0.2000
Recently, there were strong gains in bitcoin and Ethereum above $7,500 and $135 respectively against the US Dollar. It sparked bullish moves in XRP above the $0.1900 resistance area.
Moreover, there was a break above $0.1940 and the 100 hourly simple moving average. Ripple price even surpassed the 76.4% Fib retracement level of the downward move from the $0.1974 high to $0.1937 low.
It seems like the price may soon surpass the $0.1974 swing high in the near term. The next key resistance is near the $0.1985 level. It coincides with the 1.236 Fib extension level of the downward move from the $0.1974 high to $0.1937 low.
In the mentioned case, there are high possibilities of an upside break above the main $0.2000 resistance area in the near term. The next target for the bulls above $0.2000 might be $0.2120 since it represents a major pivot area.
Any further gains is likely to lead the price towards the $0.2250 resistance area in the coming days.
What If XRP Fails Near $0.2000?
If ripple fails to surpass the $0.2000 resistance area, there could be another downside correction. An initial support is near the $0.1950 level. However, the main support is near the $0.1940 level.
Additionally, there is a key rising channel forming with support near $0.1940 on the hourly chart of the XRP/USD pair. If there is a downside break below the $0.1940 support, the current bullish bias is likely to invalidate in the short term.
Looking at the chart, ripple price is clearly trading with a positive bias above the $0.1920 and $0.1940 support levels. If the bulls remain in action above $0.1980, the price is likely to surge above $0.2000 and $0.2050.
Technical Indicators
Hourly MACD – The MACD for XRP/USD is slowly moving into the bullish zone.
Hourly RSI (Relative Strength Index) – The RSI for XRP/USD is currently well above the 50 level.
Major Support Levels – $0.1950, $0.1940 and $0.1900.
Major Resistance Levels – $0.1985, $0.2000 and $0.2050.


