
Reason to trust
How Our News is Made
Strict editorial policy that focuses on accuracy, relevance, and impartiality
Ad discliamer
Morbi pretium leo et nisl aliquam mollis. Quisque arcu lorem, ultricies quis pellentesque nec, ullamcorper eu odio.
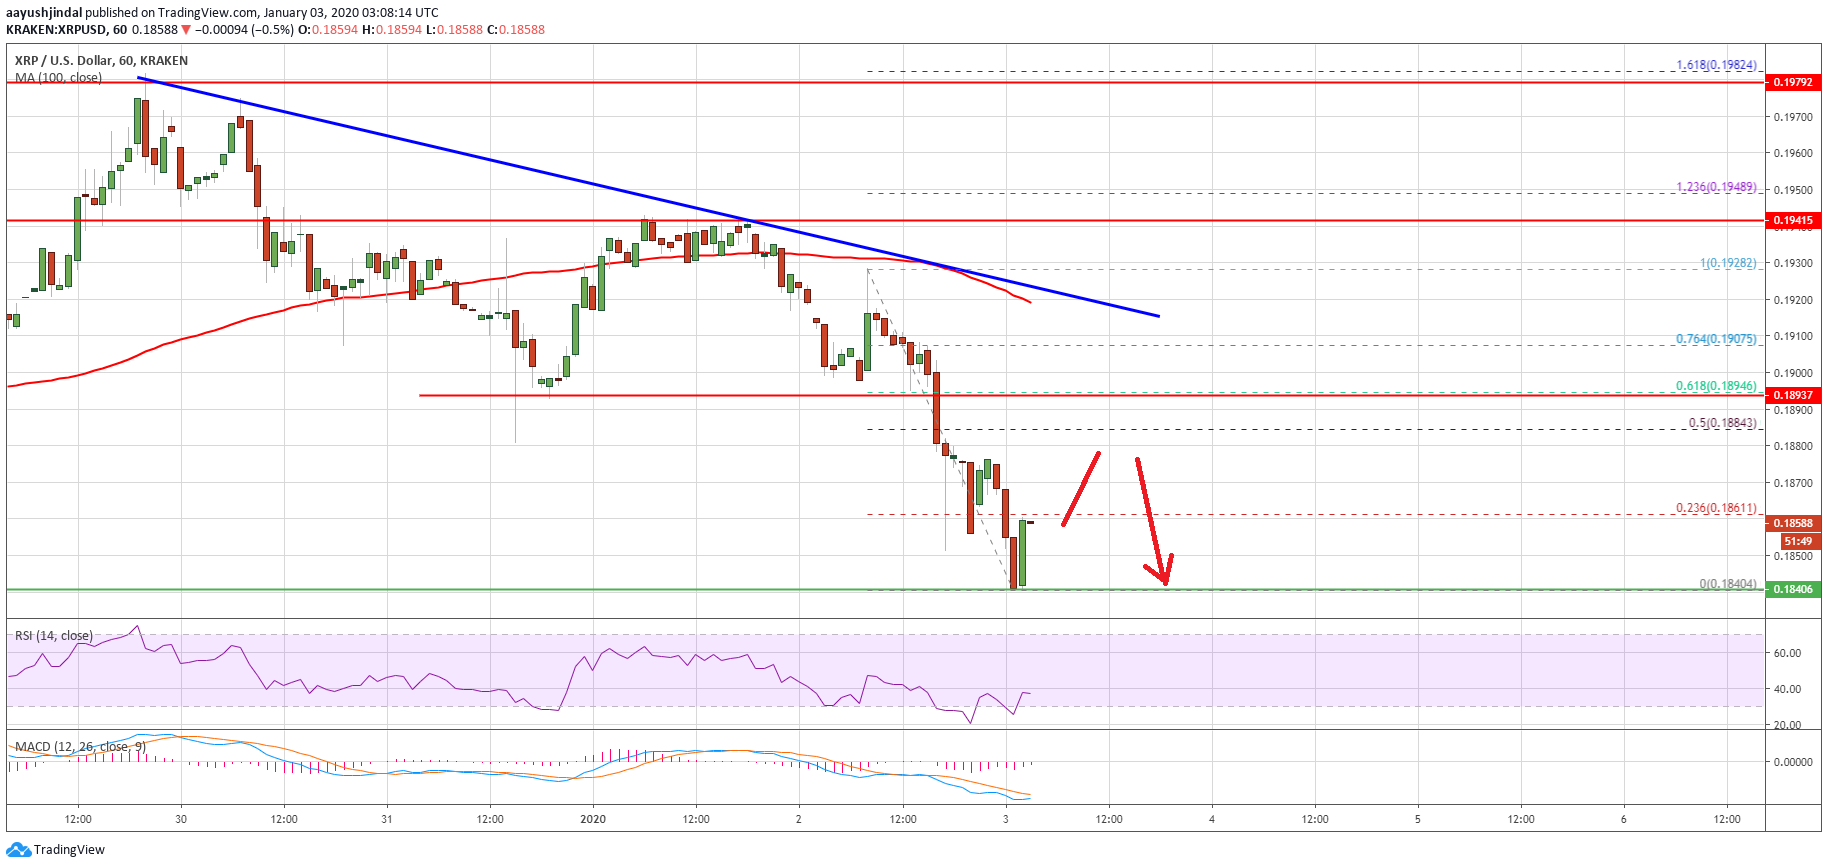
- Ripple is down more than 2% and it broke the $0.1880 support against the US dollar.
- XRP price is now trading near the $0.1840 support area and it could correct higher.
- There is a key bearish trend line forming with resistance near $0.1920 on the hourly chart of the XRP/USD pair (data source from Kraken).
- Ethereum is also down 2% and it might continue to decline towards the $120 support.
Ripple price is gaining bearish momentum below $0.1920 against the US Dollar, similar to bitcoin. XRP might slide further if it breaks the $0.1840 support.
Ripple Price Analysis
Yesterday, we discussed the chances of a larger breakout in ripple if it breaks $0.2000 against the US Dollar. However, XRP price failed to gain strength above $0.1950 and $0.2000.
As a result, there was a fresh decline and the price broke the key $0.1920 and $0.1900 support levels. Moreover, there was a close below $0.1900 and the 100 hourly simple moving average.
Finally, the price traded below $0.1880 and tested the $0.1840 support area. A low is formed near $0.1840 and ripple is currently consolidating losses. An initial resistance is seen near the $0.1860 level.
Besides, the 23.6% Fib retracement level of the recent slide from the $0.1928 high to $0.1840 low is also near the $0.1860 level. The first key resistance on the upside is near the $0.1880 level.
Additionally, the 50% Fib retracement level of the recent slide from the $0.1928 high to $0.1840 low is near the $0.1880 level. More importantly, there is a key bearish trend line forming with resistance near $0.1920 on the hourly chart of the XRP/USD pair.
Therefore, ripple price is clearly facing a lot of hurdles on the upside near the $0.1880 and $0.1900 levels. If there is an upside correction, the bears are likely to protect gains above $0.1900 in the near term.
On the downside, an immediate support is near the $0.1840 level. If there is a downside break below $0.1840, the price is likely to accelerate lower towards the $0.1800 and $0.1780 levels.
Looking at the chart, ripple price is now trading in a downtrend below $0.1900 and $0.1920. There are chances of more losses below $0.1840 and $0.1800 unless there is a strong recovery wave above $0.1920.
Technical Indicators
Hourly MACD – The MACD for XRP/USD is slowly moving into the bullish zone.
Hourly RSI (Relative Strength Index) – The RSI for XRP/USD is currently correcting higher towards the 40 level.
Major Support Levels – $0.1840, $0.1800 and $0.1780.
Major Resistance Levels – $0.1880, $0.1900 and $0.1920.


