
Reason to trust
How Our News is Made
Strict editorial policy that focuses on accuracy, relevance, and impartiality
Ad discliamer
Morbi pretium leo et nisl aliquam mollis. Quisque arcu lorem, ultricies quis pellentesque nec, ullamcorper eu odio.
- Bitcoin started a strong upward move from the $6,880 support area against the US Dollar.
- The price is reversing losses and it is now well above $7,100.
- There was a break above a key bearish trend line with resistance near $7,120 on the hourly chart of the BTC/USD pair (data feed from Kraken).
- The current technical structure suggests reversal signs towards the $7,500 resistance area.
Bitcoin price is climbing with a bullish angle above $7,000 against the US Dollar. BTC is likely to accelerate higher if it clears the $7,260 resistance.
Bitcoin Price Analysis
Recently, there was a downside extension in bitcoin below the $7,100 and $7,000 support levels against the US Dollar. BTC price spiked towards the $6,880 support and traded to a new 2020 low at $6,863.
However, the bulls took a stand, resulting in a sharp upward move above the $7,000 resistance. Besides, there was a break above the $7,080 resistance area. More importantly, there was a break above a key bearish trend line with resistance near $7,120 on the hourly chart of the BTC/USD pair.
The pair spiked above the 50% Fib retracement level of the downward move from the $7,530 high to $6,863 low. Though, the upward move was capped by the $7,260 resistance area.
Additionally, the price is facing hurdles near the 61.8% Fib retracement level of the downward move from the $7,530 high to $6,863 low. Bitcoin is currently correcting lower below $7,200.
On the downside, an initial support is near the $7,120 level and the broken trend line. The next major support is near the $7,080 level, below which the price is likely to resume its downtrend.
Conversely, the price might continue to rise above the $7,260 resistance. The next major resistance is near the $7,400 level. An intermediate resistance is the 76.4% Fib retracement level of the downward move from the $7,530 high to $6,863 low.
If the price continues to rise above $7,380 and $7,400, the next stop for the bulls may perhaps be $7,460 and $7,500. Any further gains could lead the price towards the $7,500 resistance area in the coming sessions.
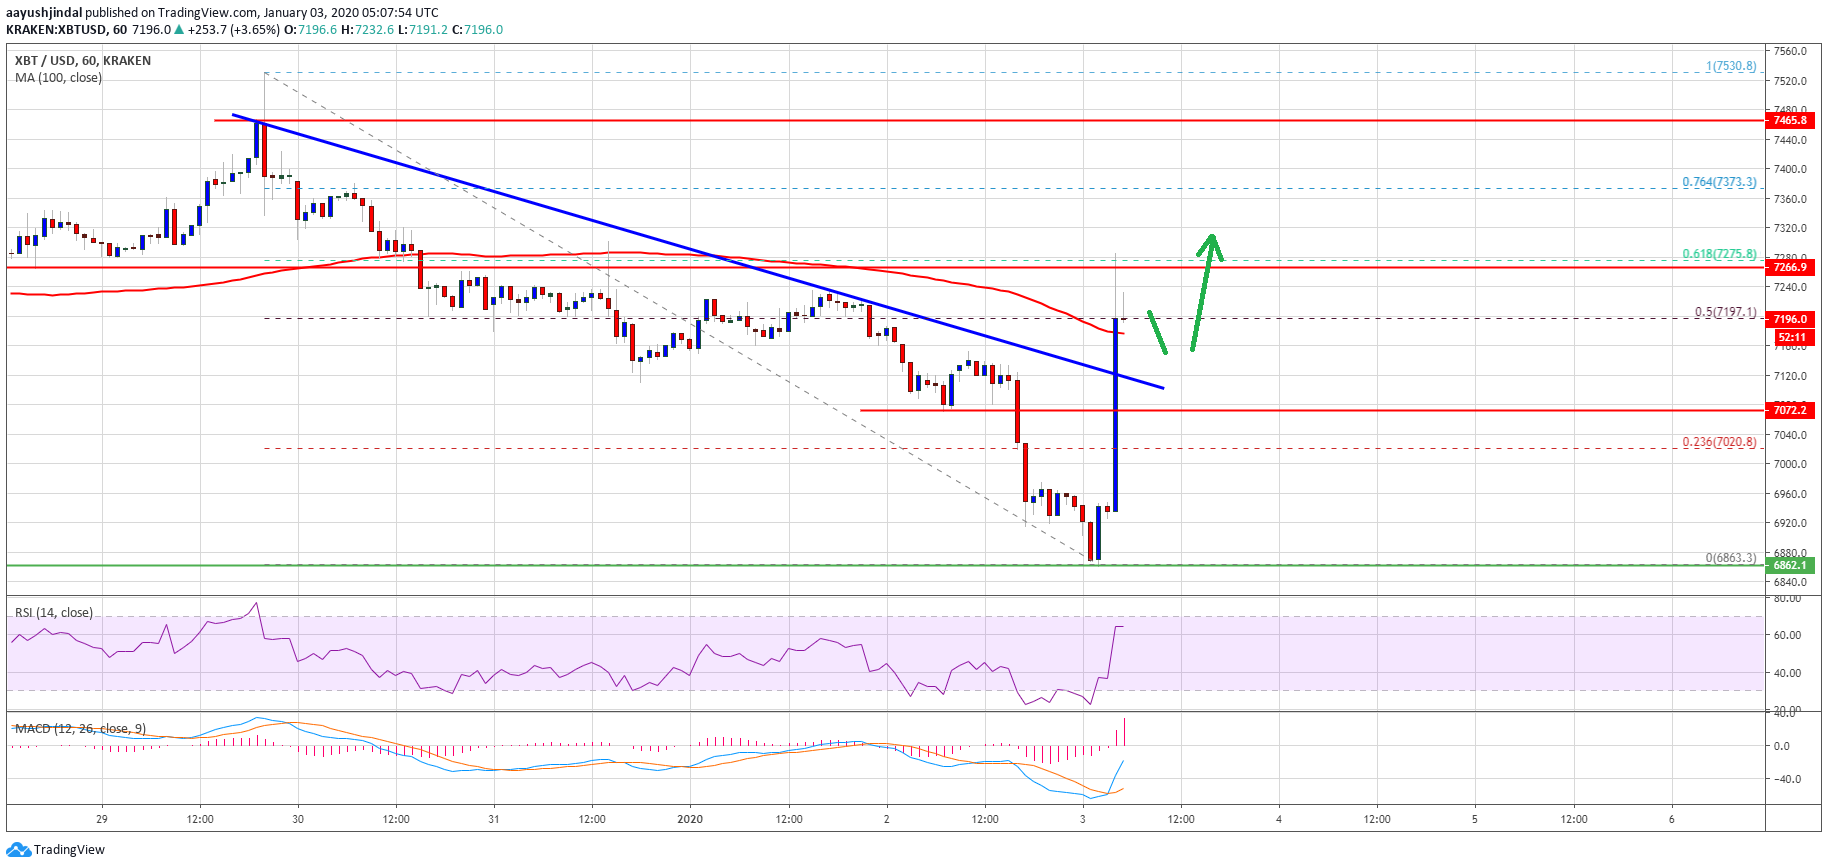
Looking at the chart, bitcoin price is reversing losses above $7,100 and the 100 hourly SMA. If there is another surge above $7,260, it will most likely confirm a trend change and a fresh increase towards $7,500.
Technical indicators:
Hourly MACD – The MACD is currently gaining strength in the bullish zone.
Hourly RSI (Relative Strength Index) – The RSI for BTC/USD is now well above the 50 level.
Major Support Levels – $7,120 followed by $7,080.
Major Resistance Levels – $7,260, $7,380 and $7,460.


