
Reason to trust
How Our News is Made
Strict editorial policy that focuses on accuracy, relevance, and impartiality
Ad discliamer
Morbi pretium leo et nisl aliquam mollis. Quisque arcu lorem, ultricies quis pellentesque nec, ullamcorper eu odio.
- Ethereum is currently trading in a range below the $130 and $132 resistances against the US Dollar.
- The price is likely to bounce back as long as it is trading above the $120 support.
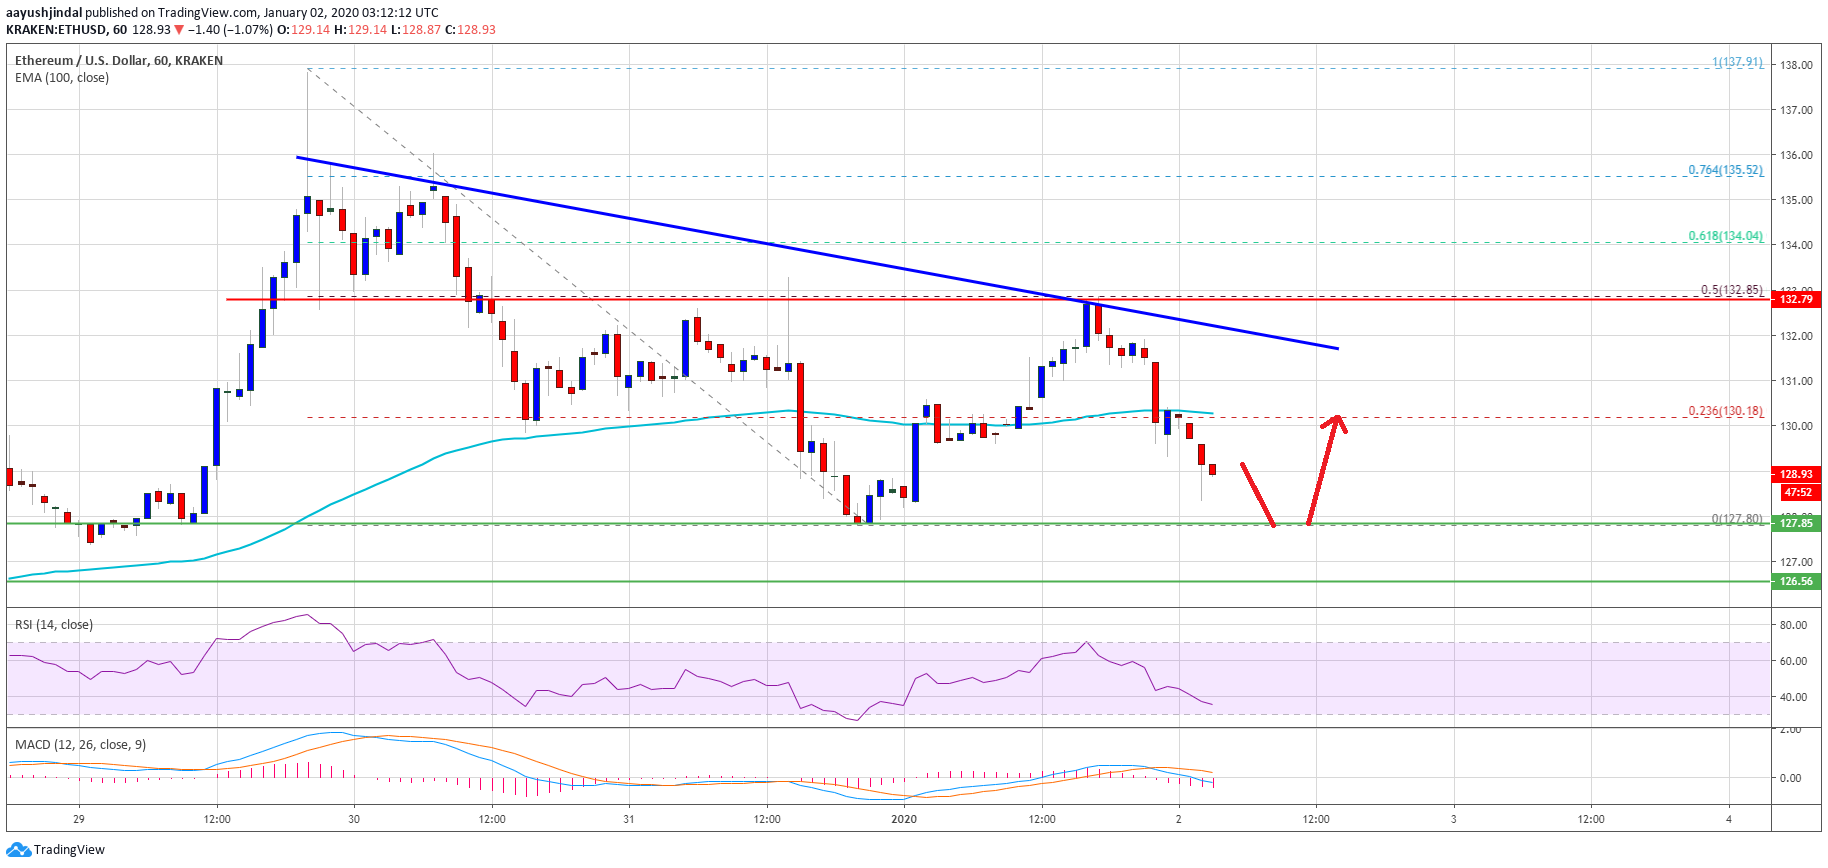
- There is a major bearish trend line forming with resistance near $132 on the hourly chart of ETH/USD (data feed via Kraken).
- ETH could spike towards the $120 support before it starts a real upward move.
Ethereum price is showing a few positive signs versus the US Dollar and bitcoin. ETH price remains well supported for a fresh increase unless it breaks $120.
Ethereum Price Analysis
Recently, Ethereum price found support near the $128 level and started an upside correction against the US Dollar. ETH price recovered above the $130 level and the 100 hourly simple moving average.
Moreover, there was a break above the 23.6% Fib retracement level of the downward move from the $138 high to $128 low. However, the price failed to clear the key $132 resistance area.
It seems like the price failed to clear the 50% Fib retracement level of the downward move from the $138 high to $128 low. It is currently declining and it is trading below $130 and the 100 hourly simple moving average.
Ethereum price might continue to slide unless there is a break above the $130 and $132 resistance levels. Besides, there is a major bearish trend line forming with resistance near $132 on the hourly chart of ETH/USD.
A clear close above the $132 zone could open the doors for more gains in the near term. The next major hurdle is near the $135 level. It represents the 76.4% Fib retracement level of the downward move from the $138 high to $128 low.
Any further gains could start a real upward move above the $138 and $140 resistance levels. On the other hand, the price might continue to decline below the $128 support. The next support is near the $125 level, below which it may perhaps spike towards the $120 support.
Looking at the chart, Ethereum price is trading above a few key supports such as $128 and $125. There are even chances of a downside spike towards the $120 level. Having said that, the bulls are likely to aim a new yearly high above $135 in the near term unless there is a break below $120.
ETH Technical Indicators
Hourly MACD – The MACD for ETH/USD is slowly moving into the bearish zone.
Hourly RSI – The RSI for ETH/USD is currently well below the 50 level.
Major Support Level – $125
Major Resistance Level – $132


