
Reason to trust
How Our News is Made
Strict editorial policy that focuses on accuracy, relevance, and impartiality
Ad discliamer
Morbi pretium leo et nisl aliquam mollis. Quisque arcu lorem, ultricies quis pellentesque nec, ullamcorper eu odio.
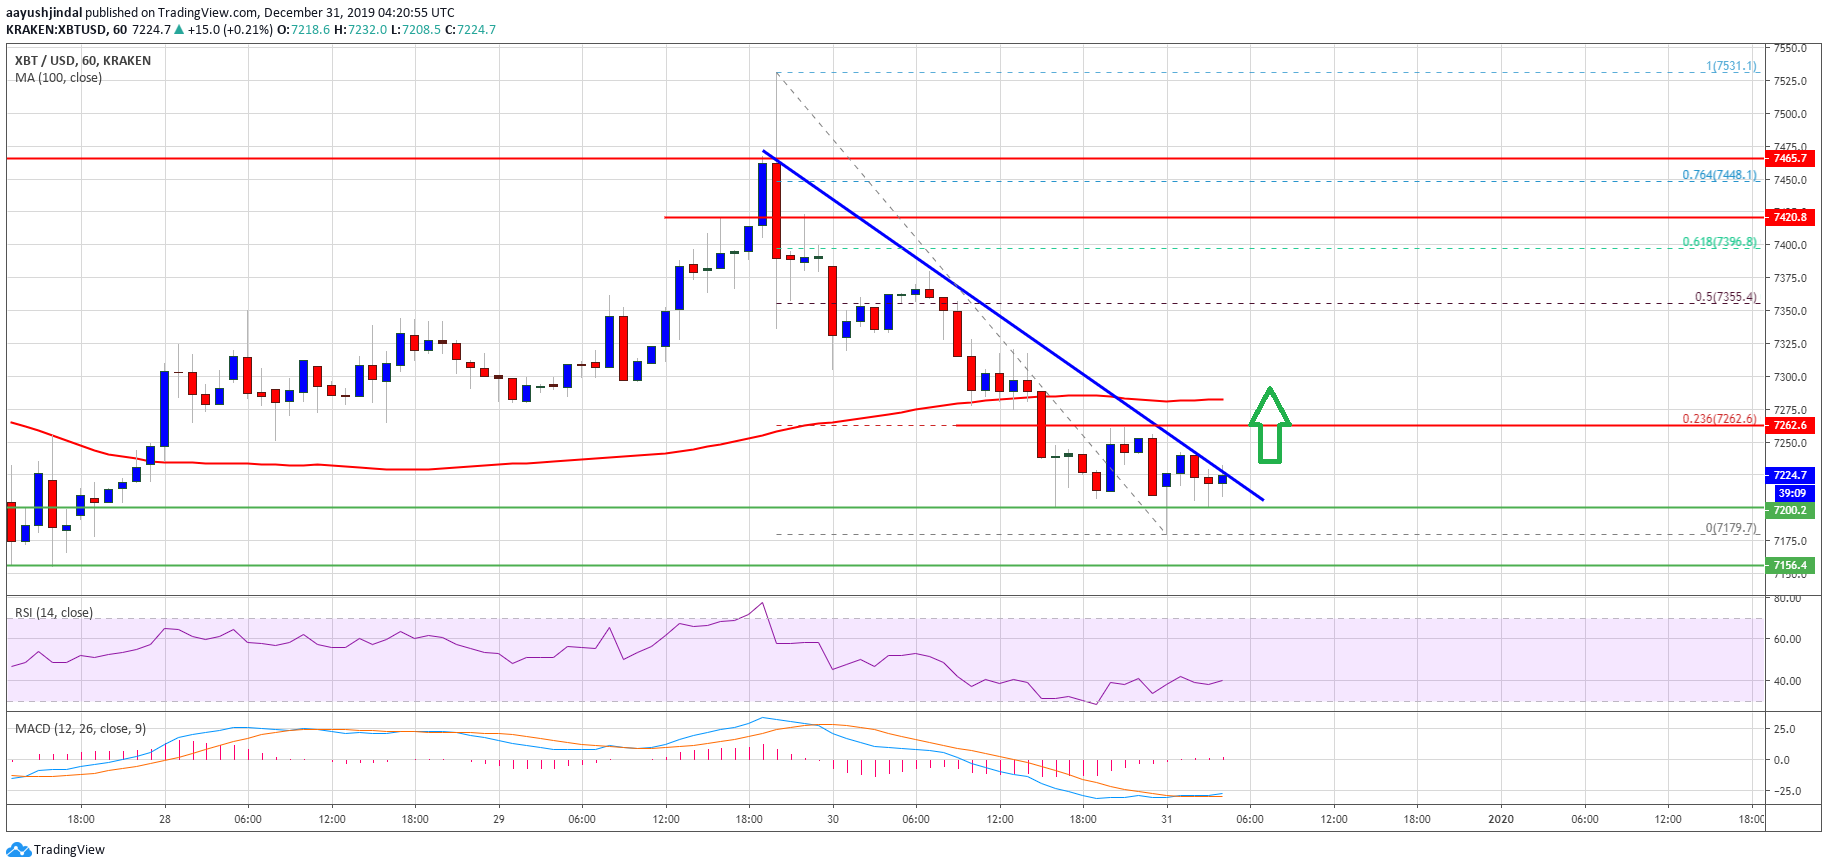
- Bitcoin price is currently consolidating above the $7,200 and $7,150 support levels against the US Dollar.
- The price is likely to climb higher again unless there is a daily close below $7,000.
- There is a key bearish trend line forming with resistance near $7,240 on the hourly chart of the BTC/USD pair (data feed from Kraken).
- The pair will most likely break $7,240 and $7,300 to start a fresh increase heading into 2020.
Bitcoin price is showing signs of a renewed upward move against the US Dollar. BTC must stay above $7,150 to prepare for another push towards the $7,500 barrier.
Bitcoin Price Analysis
After forming a new weekly high near $7,531, bitcoin price started a downside correction against the US Dollar. The price declined below the $7,400 and $7,300 support levels.
Moreover, there was a close below $7,300 and the 100 hourly simple moving average. Finally, the price dived below the $7,200 support level, but it stayed above the $7,150 support area.
A low is formed near $7,179 and the price is currently consolidating losses above the $7,200 level. An immediate resistance is near the $7,240 level. Besides, there is a key bearish trend line forming with resistance near $7,240 on the hourly chart of the BTC/USD pair.
The next resistance is near the 23.6% Fib retracement level of the recent slide from the $7,531 high to $7,179 low. However, the first major hurdle is near $7,300 and the 100 hourly simple moving average.
A successful break above the $7,300 barrier might push bitcoin price towards the $7,400 resistance level. An intermediate resistance could be $7,355 or the 50% Fib retracement level of the recent slide from the $7,531 high to $7,179 low.
Finally, a follow through above the $7,400 resistance might set the tone for a larger upward move towards the $7,500 and $7,600 resistance levels. Any further upsides may perhaps call for a push towards the $8,000 level.
Conversely, the price might struggle to climb above the $7,300 resistance area and the 100 hourly SMA. In the mentioned case, there is a risk of a bearish breakdown below the $7,200 and $7,150 support levels.
Looking at the chart, bitcoin price seems to be preparing for an upside break above the $7,240 and $7,300 resistance levels. A successful close above the $7,300 level will most likely lead the price towards $7,400 and $7,500.
Technical indicators:
Hourly MACD – The MACD is moving back into the bullish zone.
Hourly RSI (Relative Strength Index) – The RSI for BTC/USD is now climbing towards the 50 level.
Major Support Levels – $7,200 followed by $7,150.
Major Resistance Levels – $7,240, $7,300 and $7,500.