
Reason to trust
How Our News is Made
Strict editorial policy that focuses on accuracy, relevance, and impartiality
Ad discliamer
Morbi pretium leo et nisl aliquam mollis. Quisque arcu lorem, ultricies quis pellentesque nec, ullamcorper eu odio.
- Bitcoin price rallied recently above $7,300 before it ran into $7,500 against the US Dollar.
- The price is showing positive signs it seems like the bulls aim another test of $7,500.
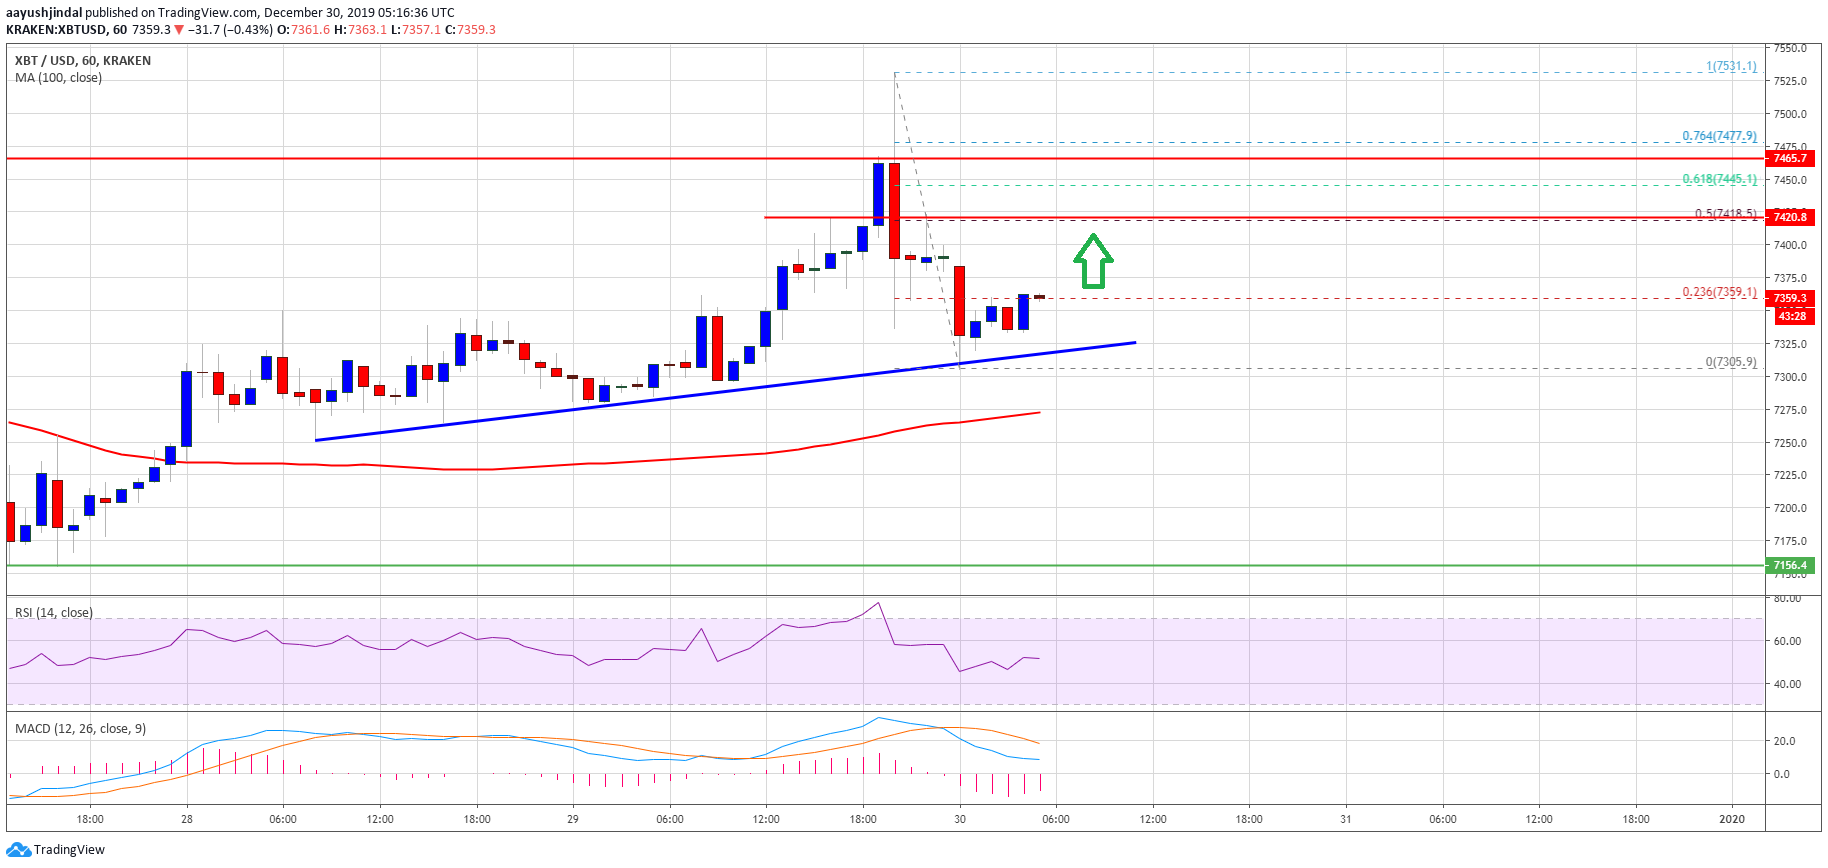
- There is a major bullish trend line forming with support near $7,325 on the hourly chart of the BTC/USD pair (data feed from Kraken).
- The pair is sighting an upside break above the $7,420 and $7,500 resistance levels.
Bitcoin price is gaining bullish momentum against the US Dollar. BTC is likely to accelerate higher once again as long as it is above the $7,200 level.
Bitcoin Price Analysis
After forming a strong support near the $7,120, bitcoin price started a nice upward move against the US Dollar. The price rallied above the $7,300 and $7,400 resistance levels.
Moreover, there was a close above $7,300 and the 100 hourly simple moving average. Finally, the price spiked above the $7,500 level, but it failed to continue higher.
A high was formed near $7,531 before the price declined heavily. Bitcoin trimmed most gains and declined below the $7,400 level. Additionally, the price traded towards the $7,300 level and a low is formed near $7,305.
The price is currently moving higher and trading above $7,340. Besides, it is near the 23.6% Fib retracement level of the recent decline from the $7,531 high to $7,305 low.
On the upside, there are many hurdles starting with the $7,400 level. More importantly, the 50% Fib retracement level of the recent decline from the $7,531 high to $7,305 low is near the $7,420 level to stop the upward move.
The main resistance is still near the $7,500 level, above which bitcoin price is likely to accelerate higher. In the mentioned case, the next stop for the bulls could be near the $7,680 and $7,700 levels.
Conversely, the price might continue to struggle near $7,400 and $7,420. On the downside, an initial support is near the $7,325 level. There is also a major bullish trend line forming with support near $7,325 on the hourly chart of the BTC/USD pair.
Looking at the chart, bitcoin price is showing a lot of positive signs above the $7,300 level. Therefore, the price is likely to continue higher towards $7,500 and $7,700 unless the bears are able to push the price below the $7,200 support.
Technical indicators:
Hourly MACD – The MACD is slowly reducing its bearish slope.
Hourly RSI (Relative Strength Index) – The RSI for BTC/USD is now above the 50 level, with positive signs.
Major Support Levels – $7,325 followed by $7,200.
Major Resistance Levels – $7,400, $7,420 and $7,500.


