
Reason to trust
How Our News is Made
Strict editorial policy that focuses on accuracy, relevance, and impartiality
Ad discliamer
Morbi pretium leo et nisl aliquam mollis. Quisque arcu lorem, ultricies quis pellentesque nec, ullamcorper eu odio.
- Bitcoin price spiked towards $7,400, but it failed to retain strength against the US Dollar.
- The bulls need to protect the $7,120 and $7,000 support levels in the near term.
- There is a major bearish trend line active with resistance near $7,360 on the hourly chart of the BTC/USD pair (data feed from Kraken).
- The pair could spike towards the $7,000 support area before it attempts a strong increase.
Bitcoin price is holding the key $7,120 and $7,000 support levels against the US Dollar. BTC is facing many hurdles on the upside near $7,300 and $7,400.
Bitcoin Price Analysis
After forming a support base near the $7,120, bitcoin price climbed higher recently against the US Dollar. The price rallied above the $7,250 and $7,300 resistance levels.
Moreover, there was a spike above the $7,400 level and the 100 hourly simple moving average. However, the price struggled to remain steady above the $7,400 level and formed a swing high near $7,431.
As a result, the price trimmed most gains and declined below $7,300. Besides, it is now trading well below the $7,250 level and the 100 hourly SMA. A low is formed near $7,150 and the price is currently consolidating losses.
An initial resistance is near the 23.6% Fib retracement level of the recent drop from the $7,431 high to $7,150 low. The first key resistance is near the $7,300 level.
Additionally, the 50% Fib retracement level of the recent drop from the $7,431 high to $7,150 low is near the $7,300 level. More importantly, there is a major bearish trend line active with resistance near $7,360 on the hourly chart of the BTC/USD pair.
If there is an upside break above the $7,300 level, the 100 hourly SMA, and the bearish trend line, then bitcoin price could attempt to rally above the $7,400 resistance area.
Conversely, the price might continue to struggle near $7,300 and $7,400. On the downside, the $7,120 level is a key support zone. If there is a downside break below $7,120, the price could struggle to hold the $7,000 support.
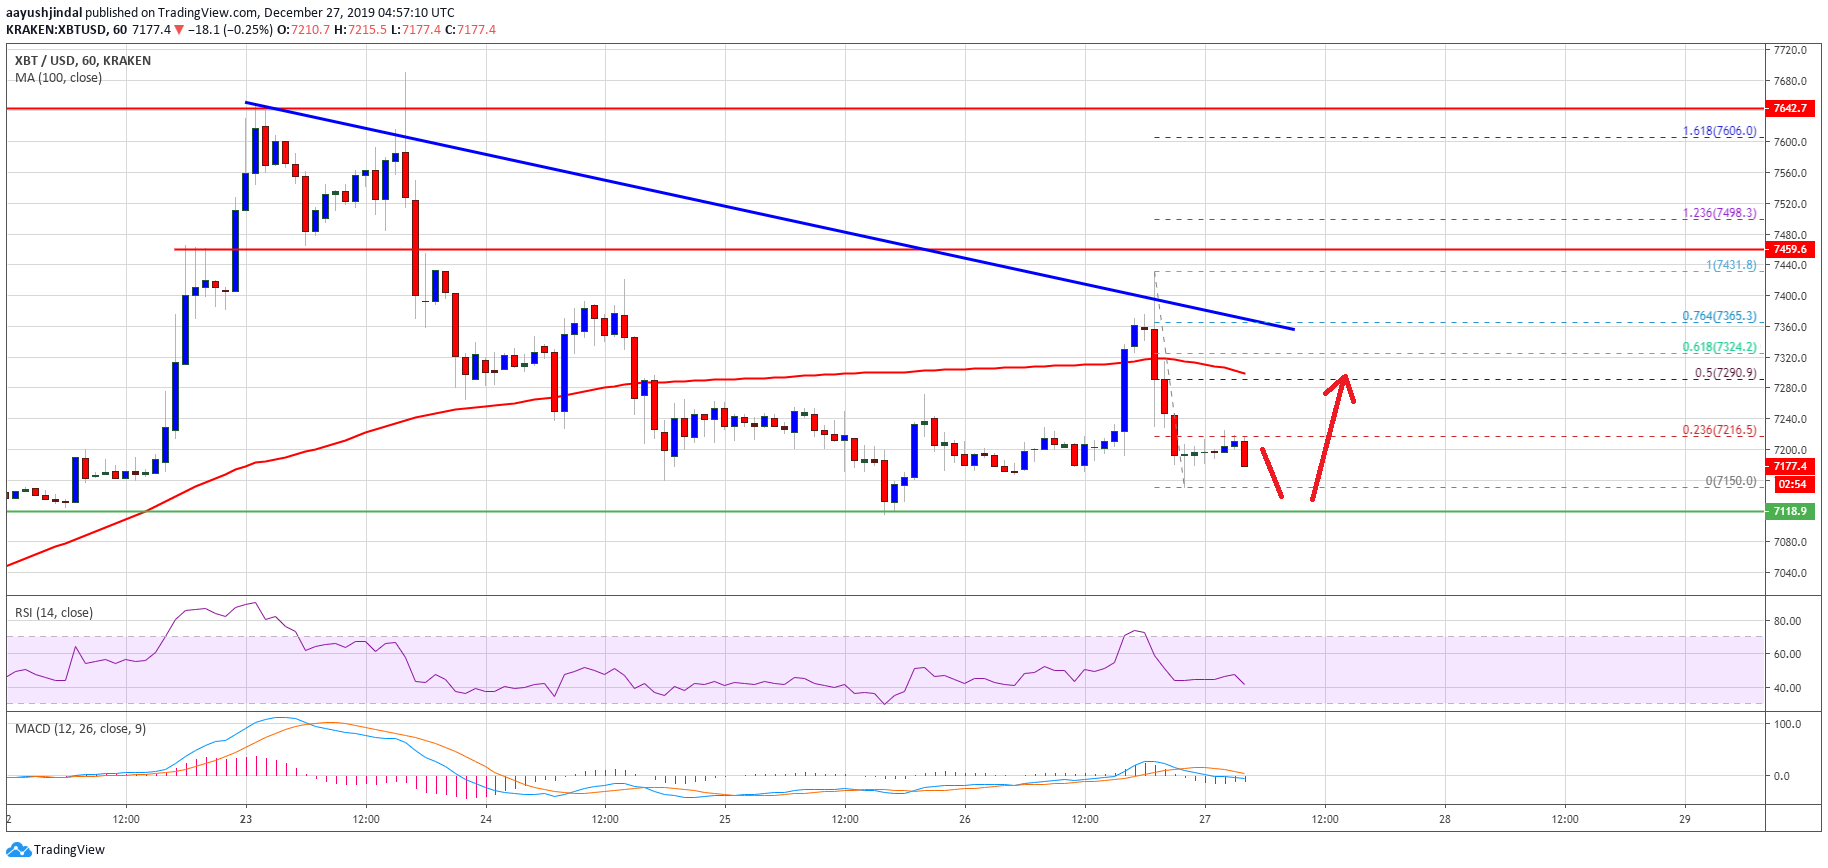
Looking at the chart, bitcoin price clearly trimmed most gains and back to the $7,120 support area. It seems like the price might spike to the downside to test the $7,000 support area before it starts a strong rise above the $7,300 and $7,400 resistance levels.
Technical indicators:
Hourly MACD – The MACD is slowly moving in the bearish zone.
Hourly RSI (Relative Strength Index) – The RSI for BTC/USD is now well below the 50 level, with a minor bearish angle.
Major Support Levels – $7,120 followed by $7,000.
Major Resistance Levels – $7,300, $7,360 and $7,400.


