
Reason to trust
How Our News is Made
Strict editorial policy that focuses on accuracy, relevance, and impartiality
Ad discliamer
Morbi pretium leo et nisl aliquam mollis. Quisque arcu lorem, ultricies quis pellentesque nec, ullamcorper eu odio.
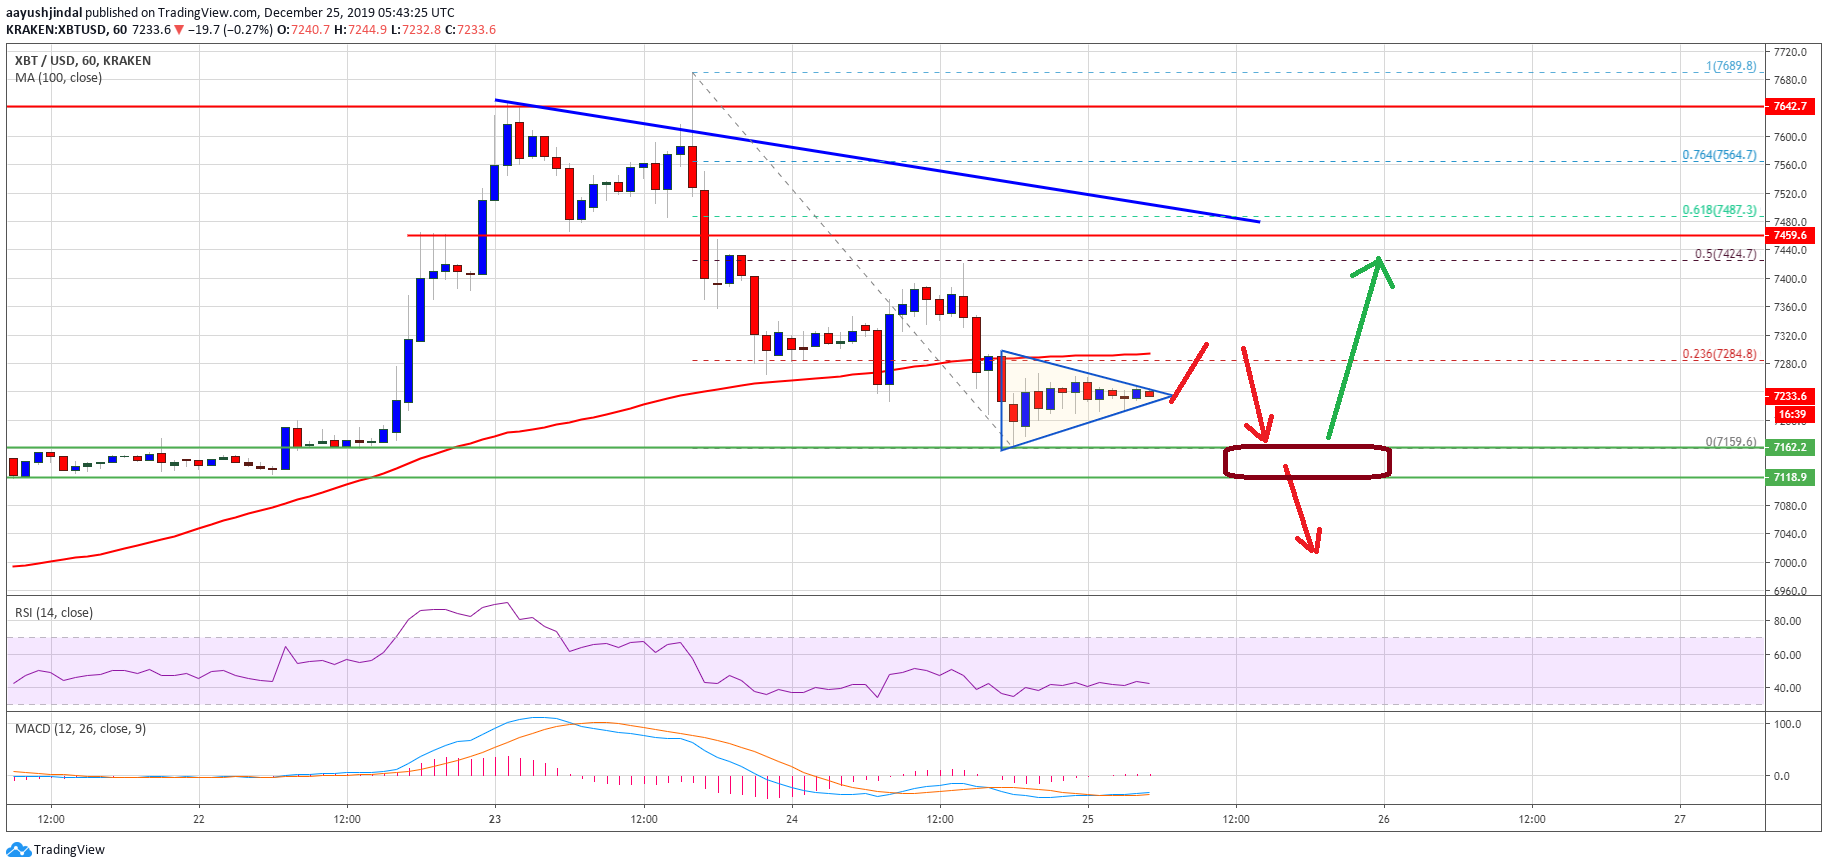
- Bitcoin price is struggling to stay above the $7,160 and $7,120 support levels against the US Dollar.
- A successful close below $7,120 could accelerate decline below $7,000.
- There is a key connecting bearish trend line forming with resistance near $7,480 on the hourly chart of the BTC/USD pair (data feed from Kraken).
- The pair could either accelerate decline below $7,000 or recover to $7,500.
Bitcoin price is showing a few bearish signs below $7,400 against the US Dollar. BTC must stay above $7,120 to avoid a nasty decline below $7,000.
Bitcoin Price Analysis
Yesterday, we saw a downside correction in bitcoin price from the $7,700 resistance area against the US Dollar. The price traded below the $7,400 and $7,300 support levels.
Moreover, the price struggled to stay above the $7,260 support and the 100 hourly simple moving average. It opened the doors for more losses and the price traded close to the $7,160 support.
A low is formed near $7,159 and the price is currently consolidating losses. It seems like there is a short term contracting triangle forming with resistance near $7,240 on the hourly chart of the BTC/USD pair.
Besides, the 23.6% Fib retracement level of the recent drop from the $7,689 high to $7,159 low is near the $7,284 level. More importantly, the 100 hourly SMA is positioned near the $7,300 level.
Therefore, a successful break above $7,240 and $7,300 might start a decent upward move. The next key resistance is near the $7,400 level or the 50% Fib retracement level of the recent drop from the $7,689 high to $7,159 low.
Additionally, there is a key connecting bearish trend line forming with resistance near $7,480 on the same chart. To start a strong upward move, bitcoin price must settle above $7,400 and $7,500.
The next major resistance is near the $7,700 level, above which the price is likely to test the $8,000 resistance. On the other hand, the price could decline further below the $7,160 and $7,120 support levels.
If the bears gain traction below $7,120, there are high chances of a sharp decline below the $7,000 support area. In the mentioned case, the price is likely to revisit the $6,660 area.
Looking at the chart, bitcoin price is showing a few bearish signs below $7,300 and $7,400. However, it could recover as long as there is no daily close below the $7,120 support.
Technical indicators:
Hourly MACD – The MACD is slowly moving into the bullish zone.
Hourly RSI (Relative Strength Index) – The RSI for BTC/USD is declining and heading towards the 40 level.
Major Support Levels – $7,160 followed by $7,120.
Major Resistance Levels – $7,300, $7,400 and $7,500.


