Reason to trust

How Our News is Made
Strict editorial policy that focuses on accuracy, relevance, and impartiality
Ad discliamer
Morbi pretium leo et nisl aliquam mollis. Quisque arcu lorem, ultricies quis pellentesque nec, ullamcorper eu odio.
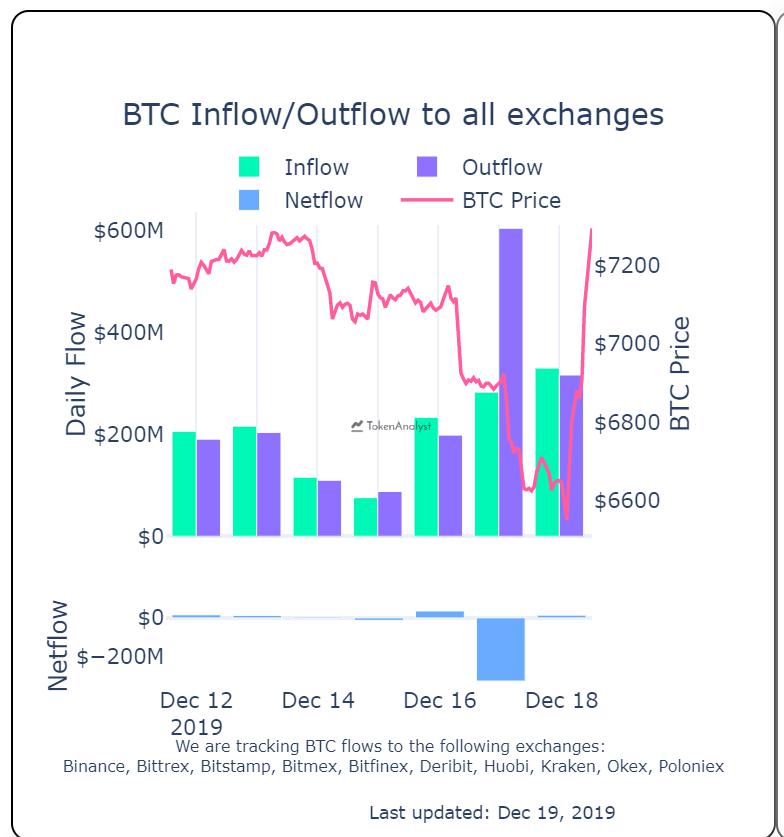
On December 17, when the bitcoin price fell to as low as $6,500 across major crypto exchanges, the outflow of BTC from exchanges spiked to $606 million.
According to data from TokenAnalyst, the outflow of bitcoin nearly tripled on Tuesday from the day prior. Coincidentally, the bitcoin price surged to $7,490 the very next day and recorded a 11 percent increase.

Often, the outflow of BTC from exchanges indicate that investors are withdrawing the dominant cryptocurrency to non-custodial wallets for long-term storage. Hence, it normally is an accurate indicator of accumulation by existing investors in the market.
Is bitcoin ready t0 start an accumulation phase?
When the bitcoin price reached the mid-$6,000 region, various technical indicators suggested that the cryptocurrency is oversold after an extended sell-off.
Since July, within less than five months, the bitcoin price plunged by more than 50 percent. Although the pullback was mainly attributed to the sell-off of BTC by a major Chinese cryptocurrency scam, it also showed that there was not enough buying demand to absorb the selling pressure.
However, after months of struggling to deal with increasing selling pressure, BTC has positioned itself for an extended recovery and a potential accumulation phase.
Alongside a noticeable increase in exchange outflows, the volume of strictly-regulated investment vehicles such as Grayscale’s Bitcoin Investment Trust (GBTC) and Bakkt rose substantially in recent weeks.
Key is the sustainability of improved sentiment
Up until early December, bitcoin was at risk of carrying over its negative sentiment to early 2020. In 2018, when miner capitulation likely occured that sent BTC to the low $3,000s, stagnancy in the market extended to the first quarter of 2019.
It was not until the second quarter of this year that the bitcoin price started to demonstrate signs of recovery.
Scott Melker, a trader at Texas West, stated that higher time frames have begun to show a bullish price trend for BTC following its short-term spike.
“This time frame shows the most bullish potential. Huge bull div with Stoch RSI (and Stoch + MACD histogram not shown), nice bounce from the bottom of the channel and potential beautiful reversal candle brewing (check back on Sunday),” he said.
Higher time frames tend to be a more accurate indicator of the future price trend of BTC over short time frames. As such, the recent rebound of BTC could result in a strong start to 2020.


