
Reason to trust
How Our News is Made
Strict editorial policy that focuses on accuracy, relevance, and impartiality
Ad discliamer
Morbi pretium leo et nisl aliquam mollis. Quisque arcu lorem, ultricies quis pellentesque nec, ullamcorper eu odio.
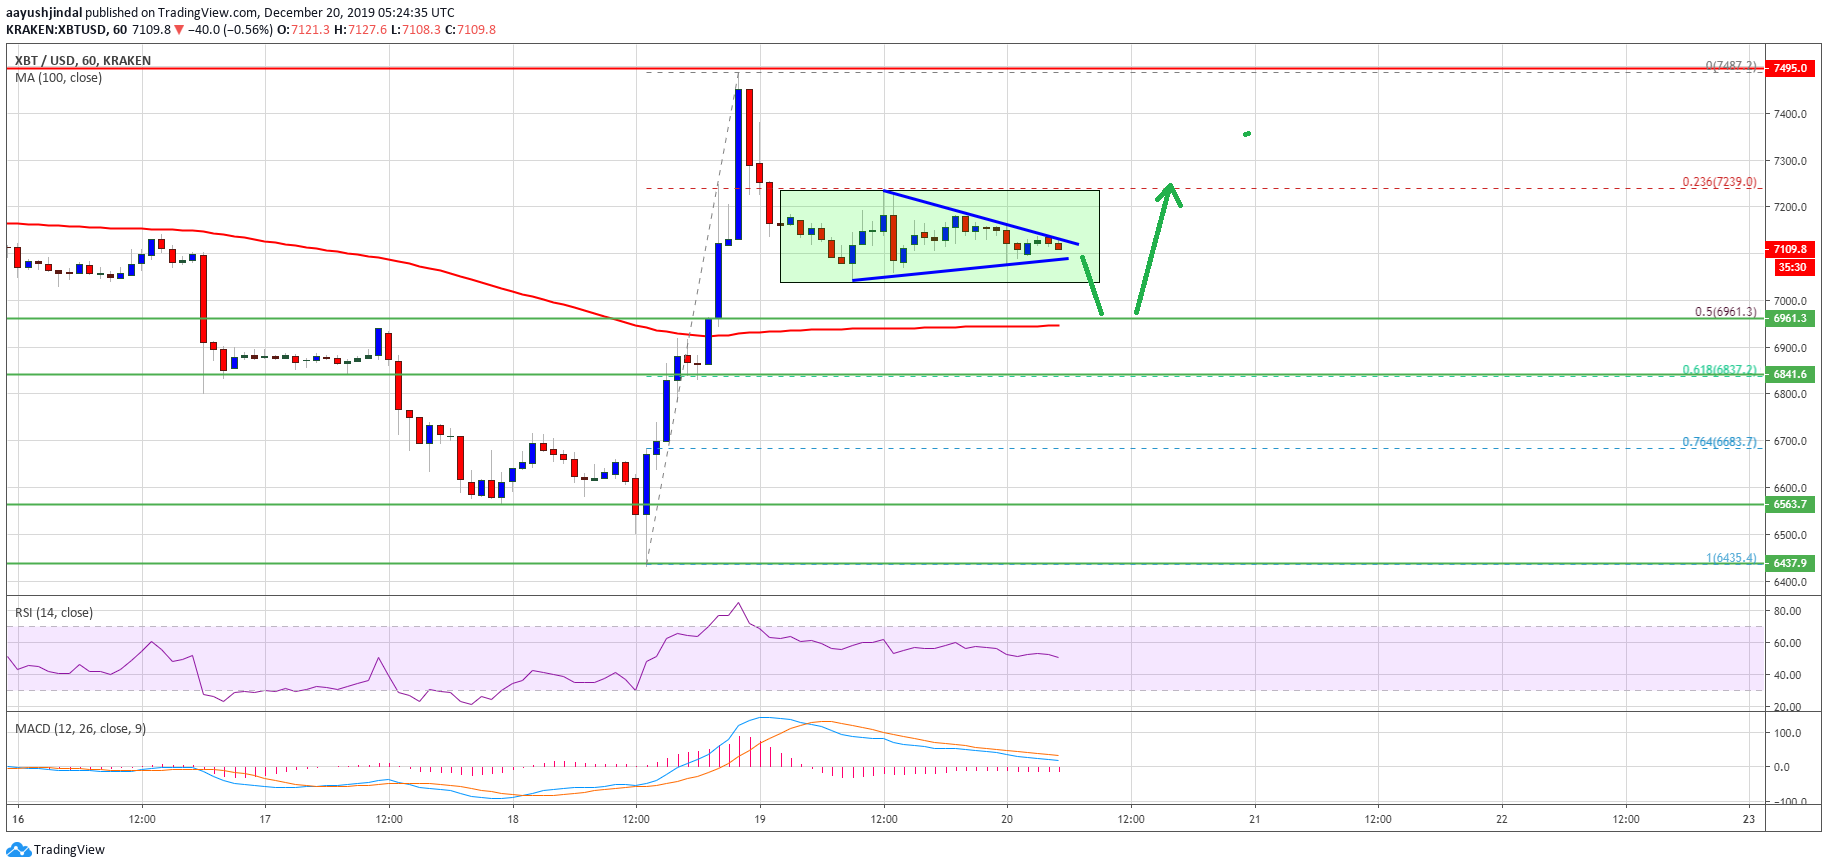
- Bitcoin price is consolidating gains above the key $7,000 support area against the US Dollar.
- The price could dip towards the $6,960 support before it starts a fresh increase.
- There is a short term contracting triangle forming with resistance near $7,135 on the hourly chart of the BTC/USD pair (data feed from Kraken).
- The bulls need to gain pace above $7,135 and $7,240 to start another increase towards $7,500.
Bitcoin price is trading in a bullish zone above $7,000 and $6,960 against the US Dollar. BTC is hesitant, but it is likely to climb further above $7,300.
Bitcoin Price Analysis
Recently, we saw a sharp rise in bitcoin above the $6,800 and $7,000 resistance levels against the US Dollar. Moreover, BTC price settled above the $7,000 level and the 100 hourly simple moving average.
A new weekly high was formed near the $7,487 level before the price started a downside correction. It traded below the $7,200 support area. Besides, there was a break below the 23.6% Fib retracement level of the recent rally from the $6,435 low to $7,490 swing high.
However, the $7,000 support area is acting as a strong buy zone. At the moment, bitcoin price is consolidating in a range above the $7,000 support. Additionally, there is a short term contracting triangle forming with resistance near $7,135 on the hourly chart of the BTC/USD pair.
If there is an upside break above the $7,135 resistance, the price could attempt to surpass the $7,240 range resistance. A successful close above the $7,240 resistance is likely to open the doors for a fresh increase towards $7,400 and $7,500.
In the mentioned case, the price is likely to accelerate above the $7,500 resistance area. Conversely, the price extend its correction below $7,100.
The first major support is near $7,000. The next one is near the $6,960 level and the 100 hourly simple moving average. The 50% Fib retracement level of the recent rally from the $6,435 low to $7,490 swing high is also near $6,960.
Therefore, the price remains well supported near the $7,000 and $6,960 support levels. Only a daily close below $6,960 could negate the bullish view for a run towards the $7,500 level in the coming sessions.
Looking at the chart, bitcoin price is clearly trading in a range above the $7,000 support area. In the short term, there could be a few bearish moves towards $6,960, but the price is likely to bounce back above $7,240 and $7,300.
Technical indicators:
Hourly MACD – The MACD is slowly moving in the bearish zone.
Hourly RSI (Relative Strength Index) – The RSI for BTC/USD is declining and is just below the 50 level.
Major Support Levels – $7,000 followed by $6,960.
Major Resistance Levels – $7,240, $7,400 and $7,500.


