
Reason to trust
How Our News is Made
Strict editorial policy that focuses on accuracy, relevance, and impartiality
Ad discliamer
Morbi pretium leo et nisl aliquam mollis. Quisque arcu lorem, ultricies quis pellentesque nec, ullamcorper eu odio.
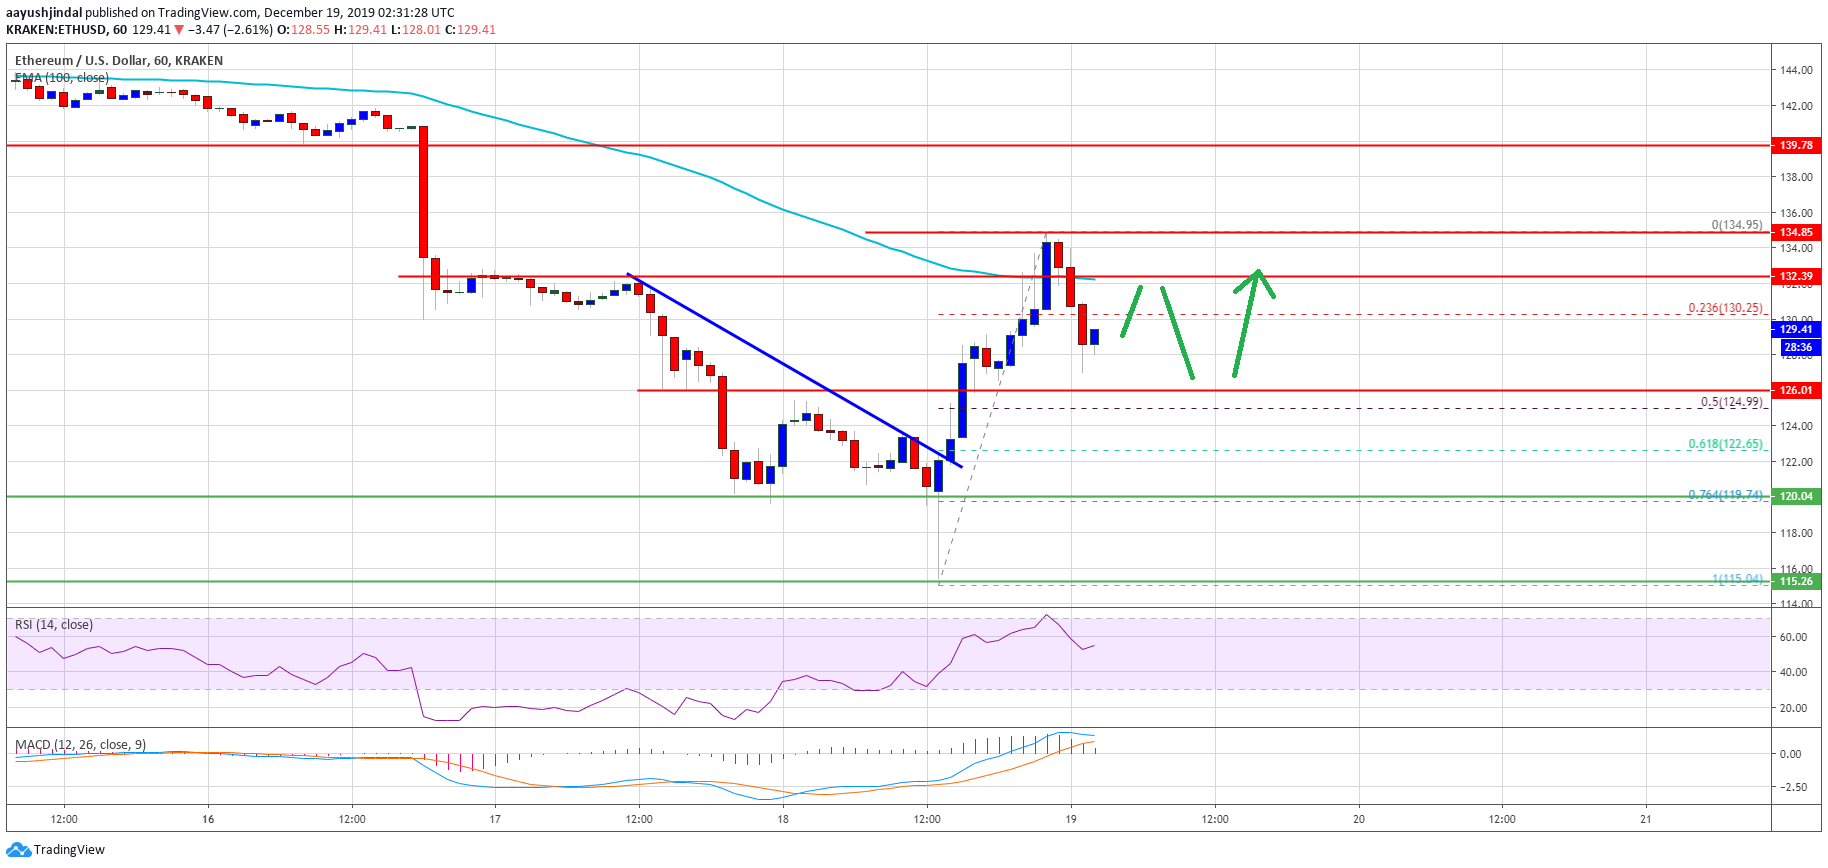
- Ethereum is up more than 8% from the recent low of $115 against the US Dollar.
- The price is showing signs of a trend reversal, but it must surpass $135.
- Earlier, there was a break above a connecting bearish trend line with resistance near $122 on the hourly chart of ETH/USD (data feed via Kraken).
- Bitcoin rallied more than 10% and reversed most its losses from well above $7,000.
Ethereum price is moving into the positive zone versus the US Dollar, while bitcoin already reclaimed $7,000. ETH price is likely to grind higher towards $135, $140 and $144.
Ethereum Price Analysis
After a massive drop, Ethereum extended its decline below the $120 support against the US Dollar. ETH price tested the $115 zone and formed a new multi-month low.
However, the bulls took a strong stand near $115, resulting in a sharp pullback above $120. Moreover, bitcoin price jumped more than 10% and rallied above $7,000 (as warned in yesterday’s analysis – Bitcoin (BTC) Bears Remain in Driver’s Seat but Bulls Not Done Yet).
Ethereum price recovered nicely above the $120 and $125 resistance levels. Besides, there was a break above a connecting bearish trend line with resistance near $122 on the hourly chart of ETH/USD.
It opened the doors for more gains above the $130 resistance area. The price seems to be back in a positive zone, but it struggled to clear the $135 resistance and the 100 hourly simple moving average.
A swing high is formed near $135 and the price is currently correcting lower. It is trading below the 23.6% Fib retracement level of the recent rally from the $115 low to $135 high.
On the downside, there are key supports forming near the $126 and $125 levels. Additionally, the 50% Fib retracement level of the recent rally from the $115 low to $135 high is near the $125 level.
Therefore, Ethereum is likely to find buyers near the $125 zone. If there is a fresh decline below $125, the price could move back into a negative zone in the near term.
Conversely, the price might continue to rise above the $130 and $135 levels. The next target for the bulls could be $140 and $144.
Looking at the chart, Ethereum price is showing signs of an important reversal above $125. More importantly, bitcoin is already up 10% and now moving nicely above the $7,000 level.
ETH Technical Indicators
Hourly MACD – The MACD for ETH/USD is currently in the bullish zone.
Hourly RSI – The RSI for ETH/USD is back above the 50 level, with positive signs.
Major Support Level – $125
Major Resistance Level – $135


