
Reason to trust
How Our News is Made
Strict editorial policy that focuses on accuracy, relevance, and impartiality
Ad discliamer
Morbi pretium leo et nisl aliquam mollis. Quisque arcu lorem, ultricies quis pellentesque nec, ullamcorper eu odio.
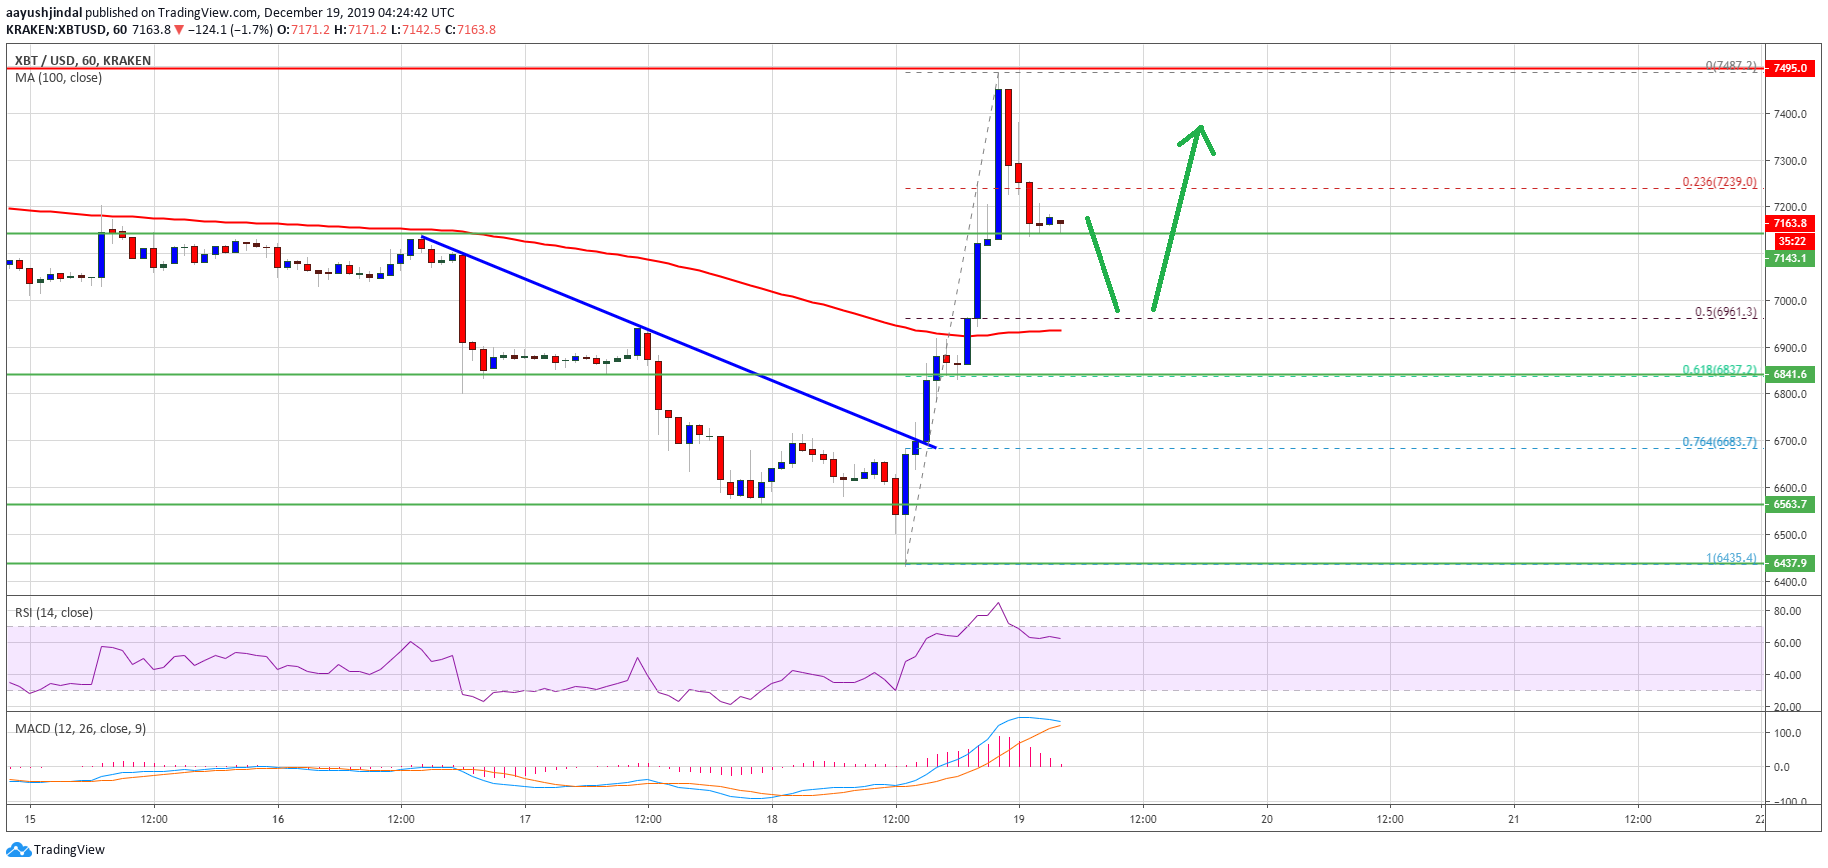
- Bitcoin price reversed its losses and settled above $7,000 against the US Dollar.
- The price rallied close to the $7,500 resistance area, where sellers emerged.
- Earlier, there was a break above a key bearish trend line with resistance near $6,700 on the hourly chart of the BTC/USD pair (data feed from Kraken).
- A correction is underway, but there are many supports near $7,150, $7,000 and $6,950.
Bitcoin price is up more than 10% and showing signs of a strong reversal against the US Dollar. However, BTC must continue above $7,500 to start a larger rally.
Bitcoin Price Analysis
After a steady decline, bitcoin spiked below the $6,600 and $6,500 support levels against the US Dollar. However, losses in BTC were limited below $6,500 (as warned in yesterday’s post – Bitcoin (BTC) Bears Remain in Driver’s Seat but Bulls Not Done Yet).
A new monthly low was formed near $6,435 before the price started a strong reversal. There was a sharp rally and the price surged above many resistances near $6,800 and $7,000.
Moreover, there was a break above a key bearish trend line with resistance near $6,700 on the hourly chart of the BTC/USD pair. The pair even settled above $7,000 and the 100 hourly simple moving average.
Finally, it spiked above the $7,200 and $7,300 resistance levels. Bitcoin traded close to the $7,500 level and a new intraday high was formed near $7,487. At the moment, the price is correcting gains below $7,300.
Additionally, there was a break below the 23.6% Fib retracement level of the recent upsurge from the $6,435 low to $7,487 high. On the downside, there are many supports near $7,150, $7,100 and $7,000.
The main support is near the $6,950 level and the 100 hourly simple moving average. Besides, the 50% Fib retracement level of the recent upsurge from the $6,435 low to $7,487 high is near the $6,960 level.
Therefore, dips remain well supported on the downside near the $7,000 and $6,950 levels. On the upside, the price is facing key hurdles near $7,400 and $7,500. A successful daily close above $7,500 would make the case for a larger rally towards $8,000 and $8,200.
Looking at the chart, bitcoin price is clearly showing a lot of positive signs above the $7,000 level. In the short term, there could be a downside reaction, but the bulls are likely to protect losses below $6,950.
Technical indicators:
Hourly MACD – The MACD is slowly moving into the bearish zone.
Hourly RSI (Relative Strength Index) – The RSI for BTC/USD is now well above the 50 level.
Major Support Levels – $7,100 followed by $7,000.
Major Resistance Levels – $7,300, $7,400 and $7,500.