Reason to trust
How Our News is Made
Strict editorial policy that focuses on accuracy, relevance, and impartiality
Ad discliamer
Morbi pretium leo et nisl aliquam mollis. Quisque arcu lorem, ultricies quis pellentesque nec, ullamcorper eu odio.
- Ripple price is diving below $0.1900 and it recently traded to a new 2-year low against the US dollar.
- It broke a significant support, opening the doors for further losses below $0.1800.
- There is a key bearish trend line forming with resistance near $0.2100 on the 4-hours chart of the XRP/USD pair (data source from Kraken).
- BTC and ETH are also sliding and gaining bearish momentum below $7,000 and $130 respectively.
Ripple price is now trading below a major multi-month support against the US Dollar. Therefore, XRP bulls need to be careful, considering chances of more losses below $0.1800.
Ripple Price Analysis
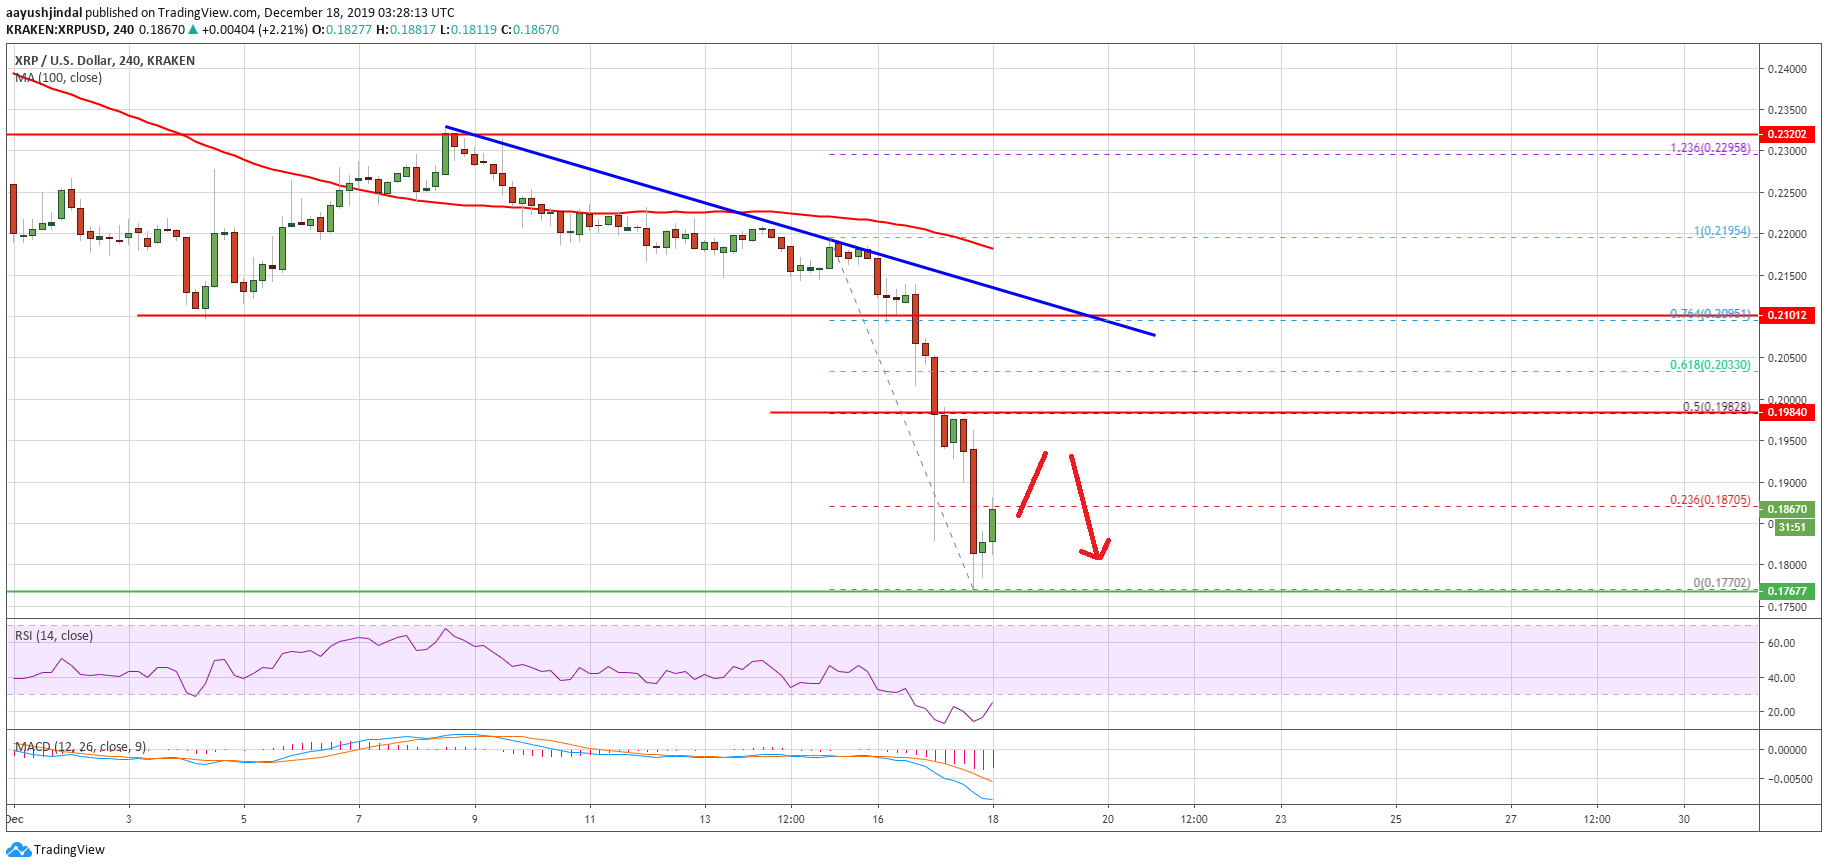
In the past few weeks, there was a steady decline in bitcoin, Ethereum and XRP against the US Dollar. Moreover, XRP price settled below the key $0.2200 pivot area and the 100 simple moving average (4-hours).
Therefore, it cleared the way for more losses below $0.2100. Finally, the price broke a major support area near the $0.2000 level and a crucial multi-month support near $0.1980.
The price declined heavily and even spiked below the $0.1800 level. A new 2-year low was formed near $0.1770 and the price is currently correcting higher. An initial resistance for ripple is near the $0.1880 level.
Besides, the 23.6% Fib retracement level of the recent decline from the $0.2195 high to $0.1770 low is near the $0.1870 level. If there is an upside correction above $0.1880, the price could recover towards the $0.1980 resistance area.
The breakdown supports near $0.1980 and $0.2000 are likely to act as key hurdles. Additionally, the 50% Fib retracement level of the recent decline from the $0.2195 high to $0.1770 low is near the $0.1982 level.
More importantly, there is a key bearish trend line forming with resistance near $0.2100 on the 4-hours chart of the XRP/USD pair. Therefore, if the price starts a recovery, it is likely to struggle near $0.2000 and $0.2100.
A successful daily close above the $0.2100 level is needed to start a strong recovery. If not, the bulls need to be very careful in the next few weeks, as there could be massive moves and drops in ripple below the $0.1800 level.
Looking at the chart, ripple price is showing signs of a short term correction, but the bears are likely to protect $0.2000. On the downside, the main supports are near $0.1800 and $0.1680.
Technical Indicators
Hourly MACD – The MACD for XRP/USD is gaining strength in the bearish zone.
Hourly RSI (Relative Strength Index) – The RSI for XRP/USD is currently well into the oversold area.
Major Support Levels – $0.1800, $0.1740 and $0.1680.
Major Resistance Levels – $0.1980, $0.2000 and $0.2100.