
Reason to trust
How Our News is Made
Strict editorial policy that focuses on accuracy, relevance, and impartiality
Ad discliamer
Morbi pretium leo et nisl aliquam mollis. Quisque arcu lorem, ultricies quis pellentesque nec, ullamcorper eu odio.
- Bitcoin price is down around 4% and it broke the key $7,000 support against the US Dollar.
- The price is likely to continue lower towards $6,500 or $6,200 in the near term.
- There is a short term contracting triangle forming with resistance near $6,880 on the hourly chart of the BTC/USD pair (data feed from Kraken).
- The pair could gather momentum once it breaks the $6,800 support area.
Bitcoin (BTC) price is showing signs of bearish continuation below $6,800 against the US Dollar. BTC bears seems to be eyeing a test of the $6,500 support or $6,200.
Bitcoin Price Analysis
After consolidating above the $7,000 support, bitcoin bears gained strength against the US Dollar. As a result, BTC price nosedived below the $7,000 support and settled well below the 100 hourly simple moving average.
The price is down around 4% and it even broke the $6,880 support area. A new monthly low is formed near $6,800 and the price is currently consolidating losses.
An immediate resistance is near the $6,880 level. Besides, the 23.6% Fib retracement level of the recent downward move from the $7,135 high to $6,800 low is also near the $6,880 area.
More importantly, there is a short term contracting triangle forming with resistance near $6,880 on the hourly chart of the BTC/USD pair. Therefore, an upside break above $6,880 level might start a short term upside correction.
The next resistance is near the $6,980 level. Additionally, the 50% Fib retracement level of the recent downward move from the $7,135 high to $6,800 low is also near the $6,980 level.
However, the main resistance is seen near the $7,000 and $7,015 levels (the recent breakdown zone). A successful daily close above $7,015 is needed to start a substantial recovery in the near term.
Conversely, the price is likely to accelerate lower below the $6,840 and $6,820 levels. If bitcoin breaks the $6,800 low, the next stop for the bears could be near $6,600 or $6,500.
Any further losses may perhaps lead the price towards the key $6,200 support area, where the bulls are likely to take a stand.
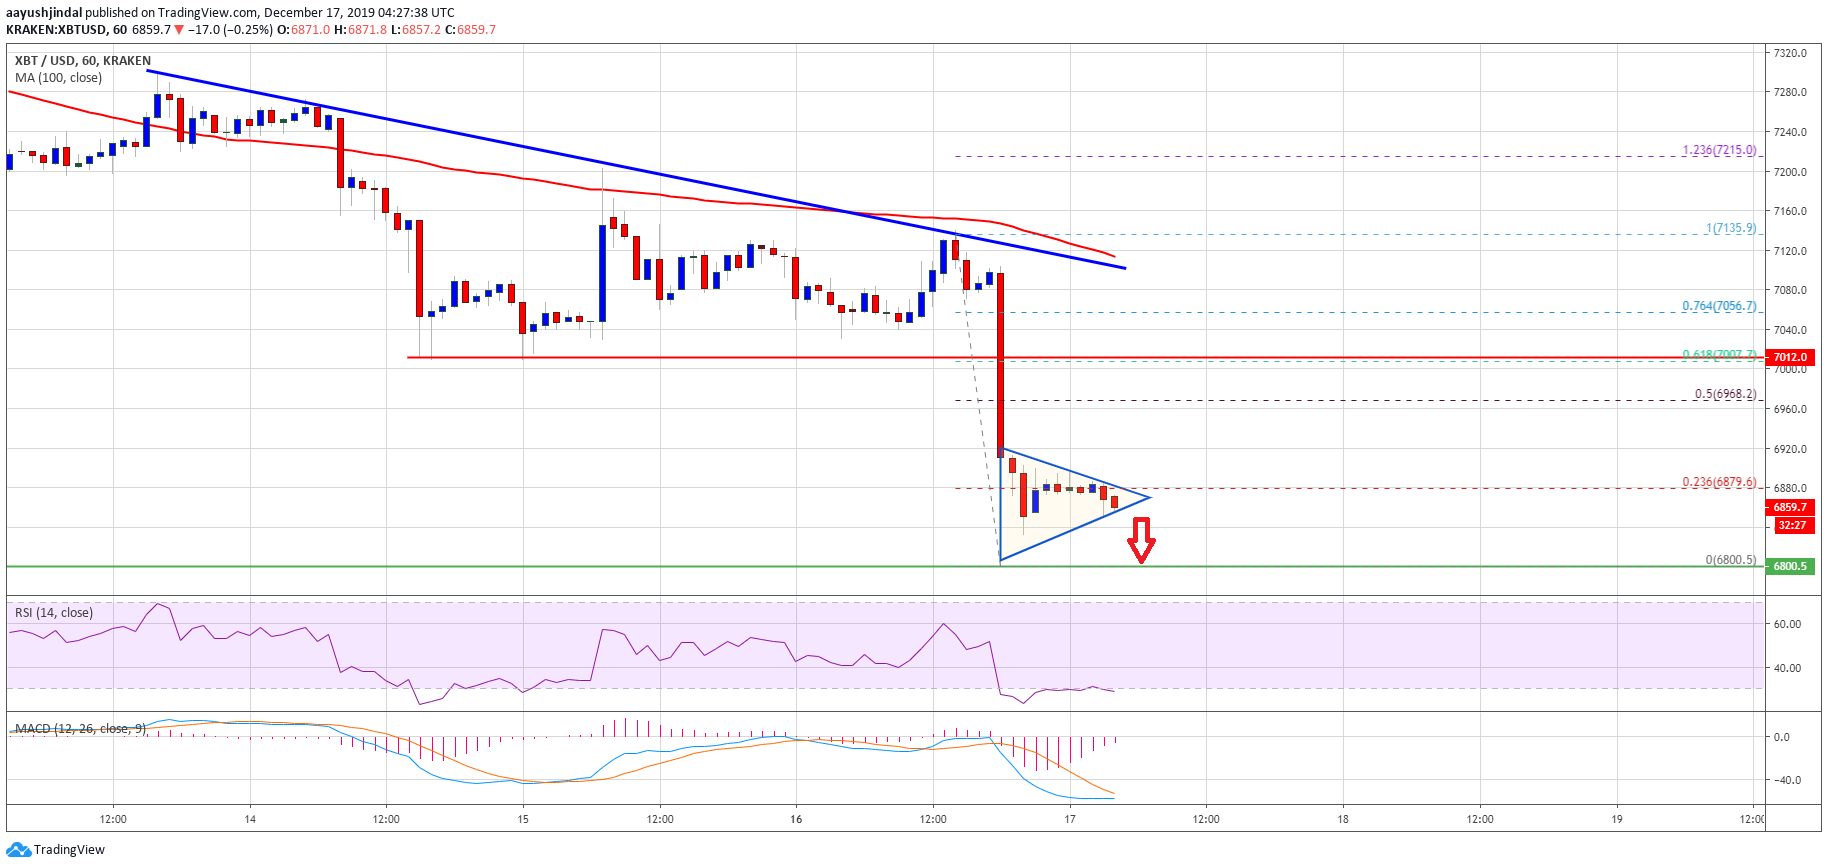
Looking at the chart, bitcoin price is sliding heavily below $7,000 and $6,880. Thus, there are high chances of more downsides as long as the price is trading below the $7,000 and $7,015 resistance levels in the near term.
Technical indicators:
Hourly MACD – The MACD is currently showing signs of an upside correction.
Hourly RSI (Relative Strength Index) – The RSI for BTC/USD is slowly recovering and it is near the 30 level.
Major Support Levels – $6,800 followed by $6,500.
Major Resistance Levels – $6,880, $7,000 and $7,015.