
Reason to trust
How Our News is Made
Strict editorial policy that focuses on accuracy, relevance, and impartiality
Ad discliamer
Morbi pretium leo et nisl aliquam mollis. Quisque arcu lorem, ultricies quis pellentesque nec, ullamcorper eu odio.
- ETH price is trading in a bearish zone below the $142 and $146 resistance levels against the US Dollar.
- The price is declining and it seems like it could continue to drop below $140.
- There is a major bearish trend line forming with resistance near $142 on the 4-hours chart of ETH/USD (data feed via Kraken).
- The pair is likely to face a lot of selling interest as long as it is below $146.
Ethereum price is struggling to recover and correct higher against the US Dollar, similar to bitcoin. ETH price remains at a risk of more downsides below $140 and $136.
Ethereum Price Weekly Analysis
This past week, Ethereum declined below the $144 and $142 support levels against the US Dollar. ETH price even spiked below the $140 support and a new monthly low was formed near $139.
Later, there was an upside correction above the $142 resistance level. However, the upward move was capped by the $145-$146 resistance zone. A high is formed near $146 and the price is currently declining.
It is trading near the $140 support area and remains at a risk of more downsides. An initial resistance is near the $141 level, which is near the 23.6% Fib retracement level of the recent decline from the $146 high to $140 low.
On the upside, there are many hurdles near the $142 and $144 levels. Besides, there is a major bearish trend line forming with resistance near $142 on the 4-hours chart of ETH/USD.
Additionally, the trend line also coincides with the 50% Fib retracement level of the recent decline from the $146 high to $140 low. Therefore, a clear break above the $142 resistance is needed for a decent recovery.
The main resistance is still near the $144 and $146 levels. Thus, if there is a successful close above the $146 resistance, the price could continue to recover towards the $152 and $155 resistance levels.
On the downside, an initial support is near the $140 level. If there is a daily close below the $140 level, there is a risk of a downside thrust towards the $135 and $132 levels in the coming sessions.
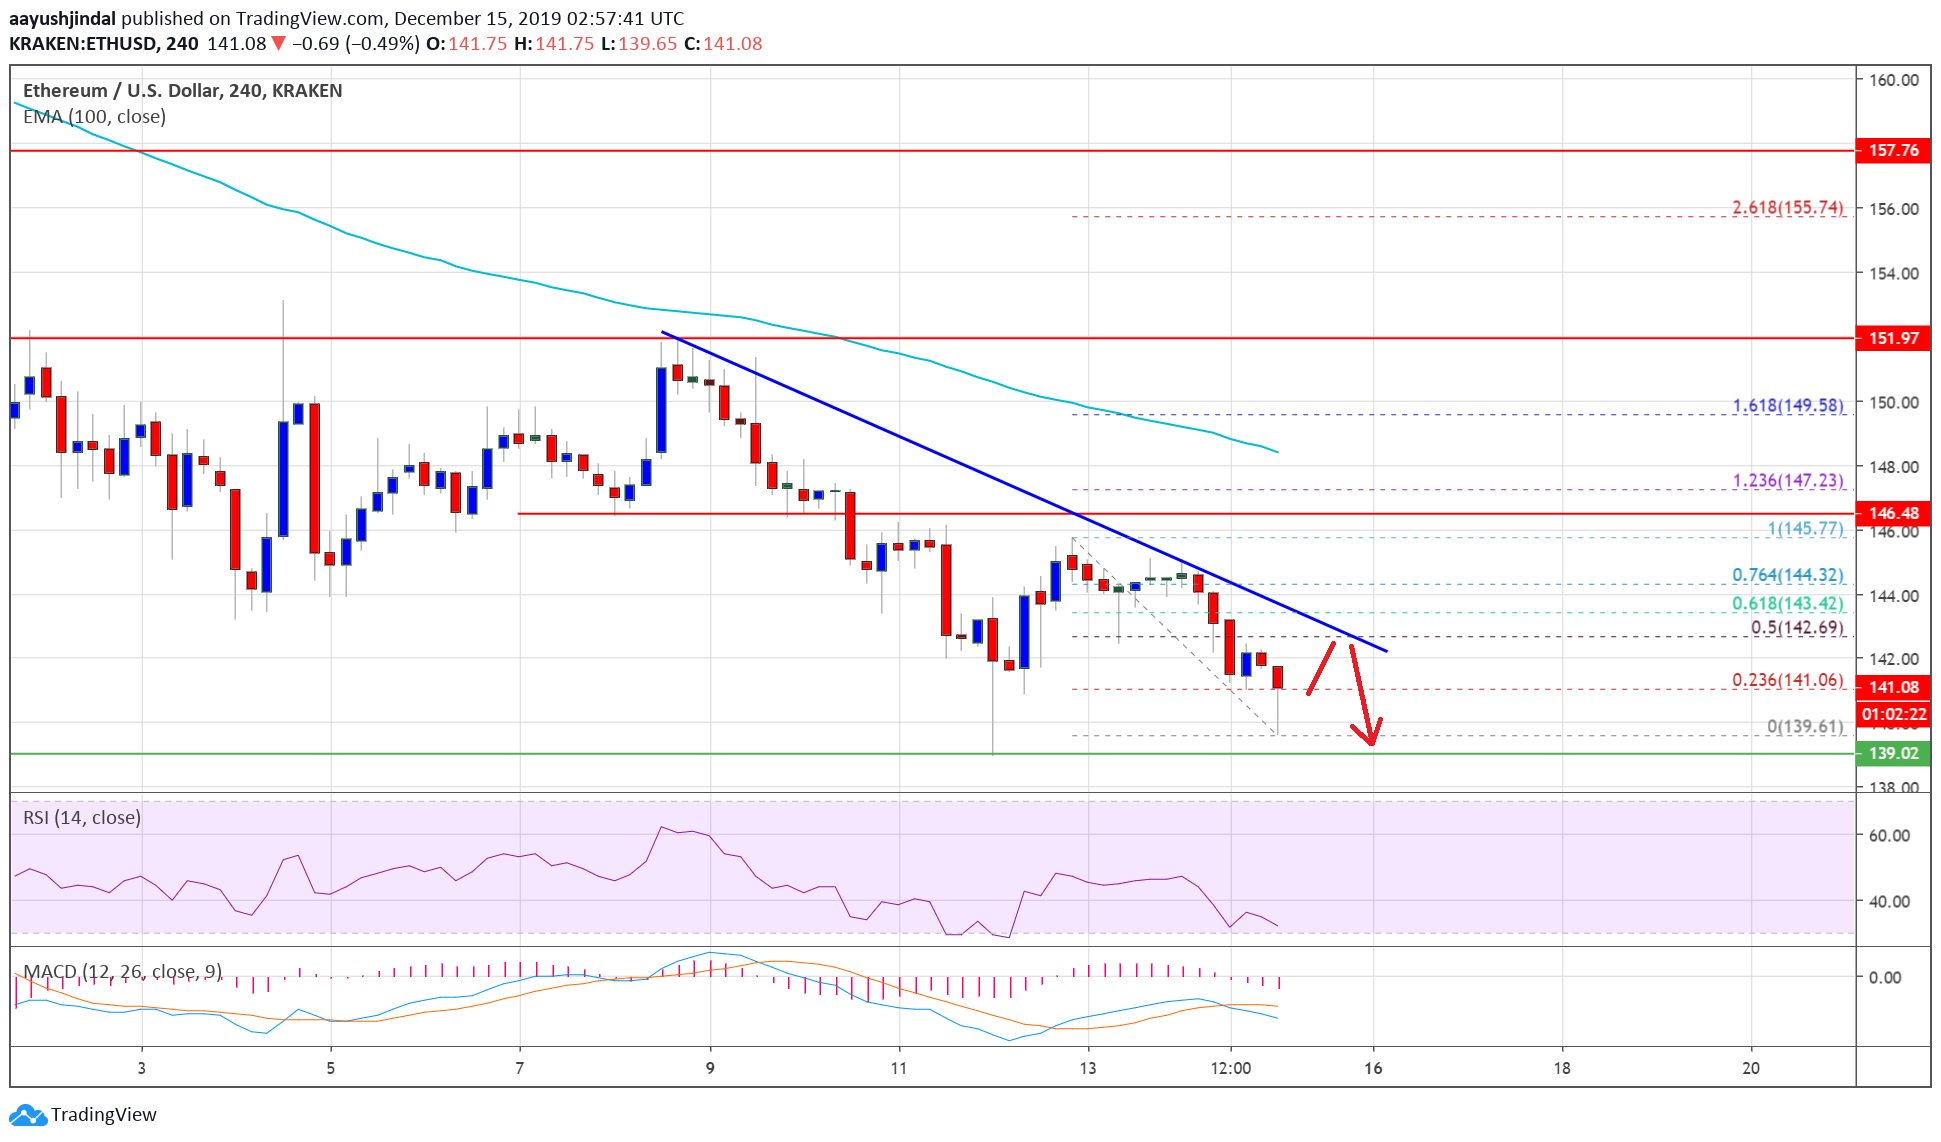
The above chart indicates that Ethereum price is facing a lot of hurdles near the $142 and $146 levels. Therefore, the bears are likely to remain in action and there is a risk of another bearish breakdown below the $140 support area.
Technical Indicators
4 hours MACD – The MACD for ETH/USD is slowly gaining strength in the bearish zone.
4 hours RSI – The RSI for ETH/USD is currently declining and it is closing in towards the 30 level.
Major Support Level – $140
Major Resistance Level – $146