Reason to trust

How Our News is Made
Strict editorial policy that focuses on accuracy, relevance, and impartiality
Ad discliamer
Morbi pretium leo et nisl aliquam mollis. Quisque arcu lorem, ultricies quis pellentesque nec, ullamcorper eu odio.
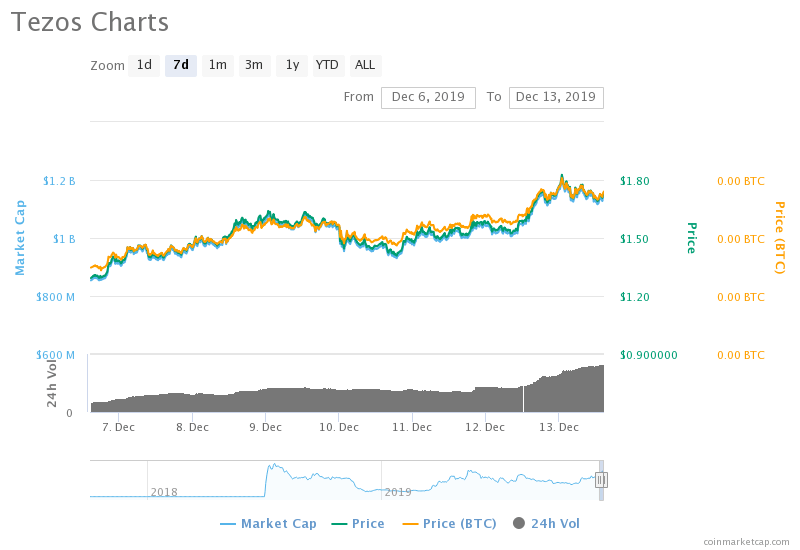
The price of blockchain asset XTZ came closer to establishing a record yearly high on Friday.
The Tezos’ native token established an intraday peak of approx $1.84, up 4.83 percent from the market’s open rate. Earlier this year, as of May 19, it had settled a year-to-date high of $1.86. The minimal price difference between the intraday and YTD high showed that bulls were attempting to close above the latter.

The latest move uphill came after the U.S.-based cryptocurrency exchange Kraken announced that it would launch a token-staking service with XTZ.
The trading house confirmed a 6 percent annual returns for anybody who hire them as their delegate to stake their XTZ holdings. Traders interpreted the announcement as a means to boost to XTZ adoption. Therefore, the token’s value rose on an intraday basis.
XTZ Up by 150% Already
Before the Kraken announcement, the XTZ-to-dollar exchange rate was already going through a parabolic bull run. The pair underwent a sharp trend reversal from a swing low of $0.732 from to $1.84 in less than two months. The move amounts to more than 150 percent, one of the sharpest price rallies seen in an otherwise bearish cryptocurrency market.
https://twitter.com/CHalexov2016/status/1205393347101233152
A string of positive developments improved Tezos’ interim bullish bias among traders. In early Novemeber, another U.S.-based cryptocurrency exchange Coinbase announced that it would offer XTZ staking services. The XTZ-to-dollar exchange rate surged by 34 percent after the announcement.
Similarly, rival cryptocurrency trading platform Binance came up with similar plans for Tezos on December 11. The XTZ price has spiked by more than 21 percent since the news.
The same pattern is playing out again with Kraken. On the whole, it is bringing new capital into the XTZ market as investors’ long-term confidence in its parent project grows.
Too Overbought
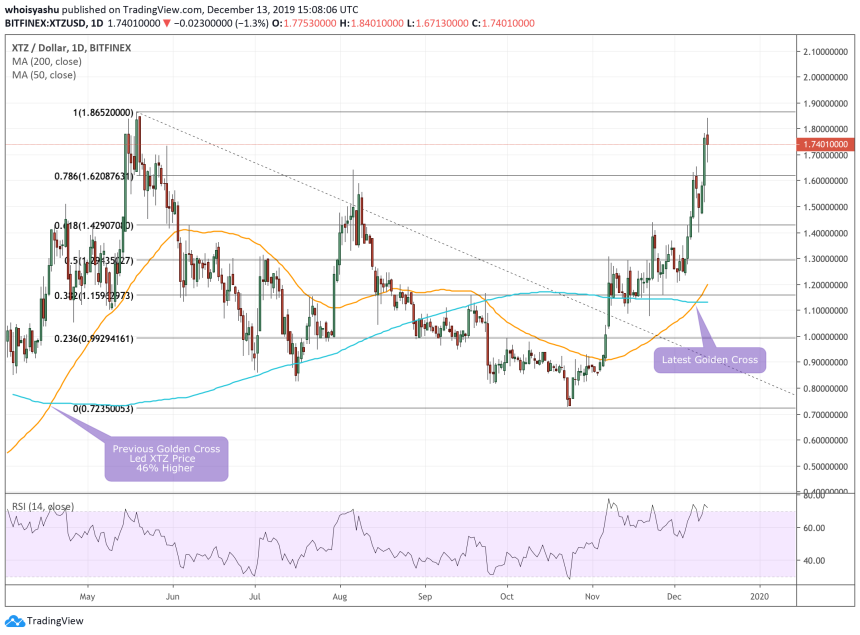
The XTZ’s parabolic price run lately formed a golden cross on its daily chart. In retrospective, a Golden Cross is a bullish signal which appears after an asset’s short-term moving average breaks above its long-term moving average. In the case of XTZ, the 50-daily MA has jumped above its 200-daily MA.

The last time XTZ formed a golden cross, the price had jumped by up to 46 percent. It is one of the many reasons why traders might want to hold XTZ for a slightly longer timeframe. A post-golden cross bull run would take the token to at least $2.4.
Nevertheless, the bull run will not be a steep one. XTZ’s daily Relative Strength Index has already signaled an overbought status. It would prompt an interim downside correction towards local support. As of now, it is near $1.62.
A trend reversal would not be confirmed unless XTZ breaks below its 50-period MA (the saffron curve).


