
Reason to trust
How Our News is Made
Strict editorial policy that focuses on accuracy, relevance, and impartiality
Ad discliamer
Morbi pretium leo et nisl aliquam mollis. Quisque arcu lorem, ultricies quis pellentesque nec, ullamcorper eu odio.
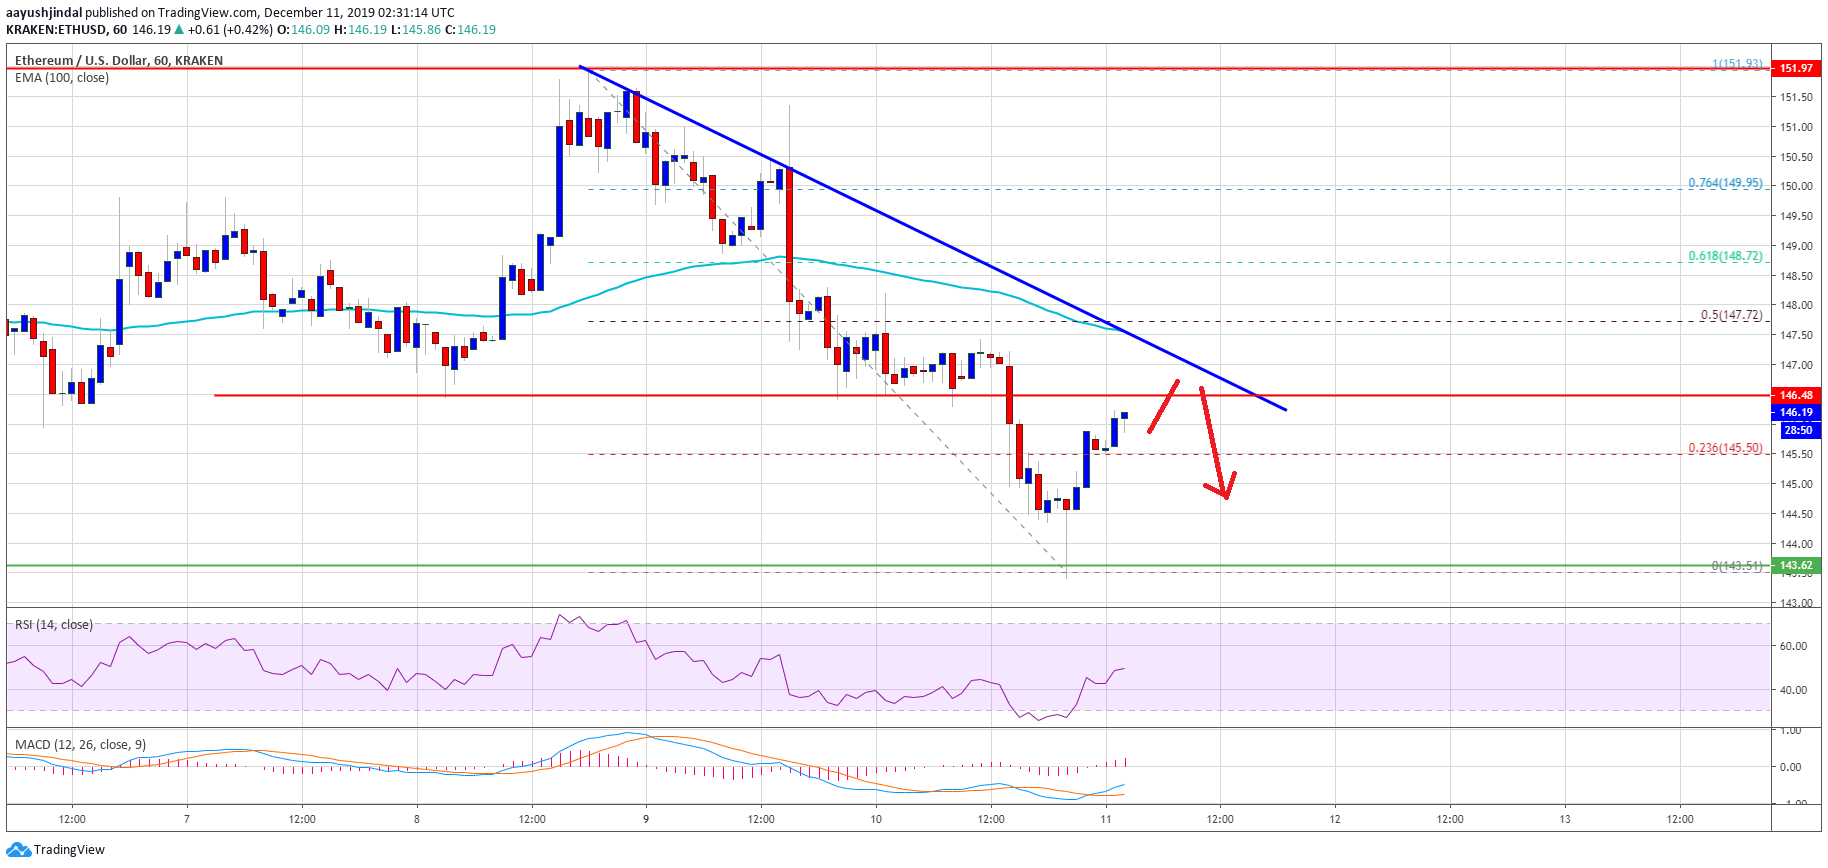
- Ethereum is holding the main $144 support, but also struggling to rise against the US Dollar.
- The price is now trading below the previous support (now resistance) near $148.
- There is a key bearish trend line forming with resistance near $147 on the hourly chart of ETH/USD (data feed via Kraken).
- The price is likely to struggle near the $147 and $148 resistance levels in the near term.
Ethereum price is facing an increase in selling versus the US Dollar, similar to bitcoin below $7,400. ETH price could even struggle to hold the key $144 and $142 supports.
Ethereum Price Analysis
After topping near the $152 resistance, Ethereum started a fresh decline against the US Dollar. ETH price broke a couple of key supports near the $150 level.
Moreover, there was a break below the $148 support area and the 100 hourly simple moving average. The decline was such that the price tested the $144 support area. A new weekly low was formed near $143.51 and the price is currently correcting higher.
It surpassed the 23.6% Fib retracement level of the recent decline from the $152 high to $144 low. However, the price is facing a lot of hurdles on the upside near the $148 area.
Besides, the 100 hourly simple moving average is also near the $148 area. More importantly, there is a key bearish trend line forming with resistance near $147 on the hourly chart of ETH/USD.
The trend line also coincides with the 50% Fib retracement level of the recent decline from the $152 high to $144 low. Therefore, an upside break above the $148 zone is needed for a push towards the main $152 resistance area.
Finally, Ethereum bulls need to gain strength above the $152 area to start a strong rise towards the $160 and $162 levels. Conversely, the price could continue to move down below $144.
The main support is near the $142 area. If there is a successful close below the $142 area, there is a risk of a sharp decline towards the $135 and $132 levels in the near term.
Looking at the chart, Ethereum price is showing a few negative signs below the $148 and $152 levels. It seems like there is a broad range forming and sooner or later the price could either rally above $152 or dive sharply below $142.
ETH Technical Indicators
Hourly MACD – The MACD for ETH/USD is slowly moving back into the bullish zone.
Hourly RSI – The RSI for ETH/USD is currently correcting higher towards the 50 level.
Major Support Level – $142
Major Resistance Level – $152


