
Reason to trust
How Our News is Made
Strict editorial policy that focuses on accuracy, relevance, and impartiality
Ad discliamer
Morbi pretium leo et nisl aliquam mollis. Quisque arcu lorem, ultricies quis pellentesque nec, ullamcorper eu odio.
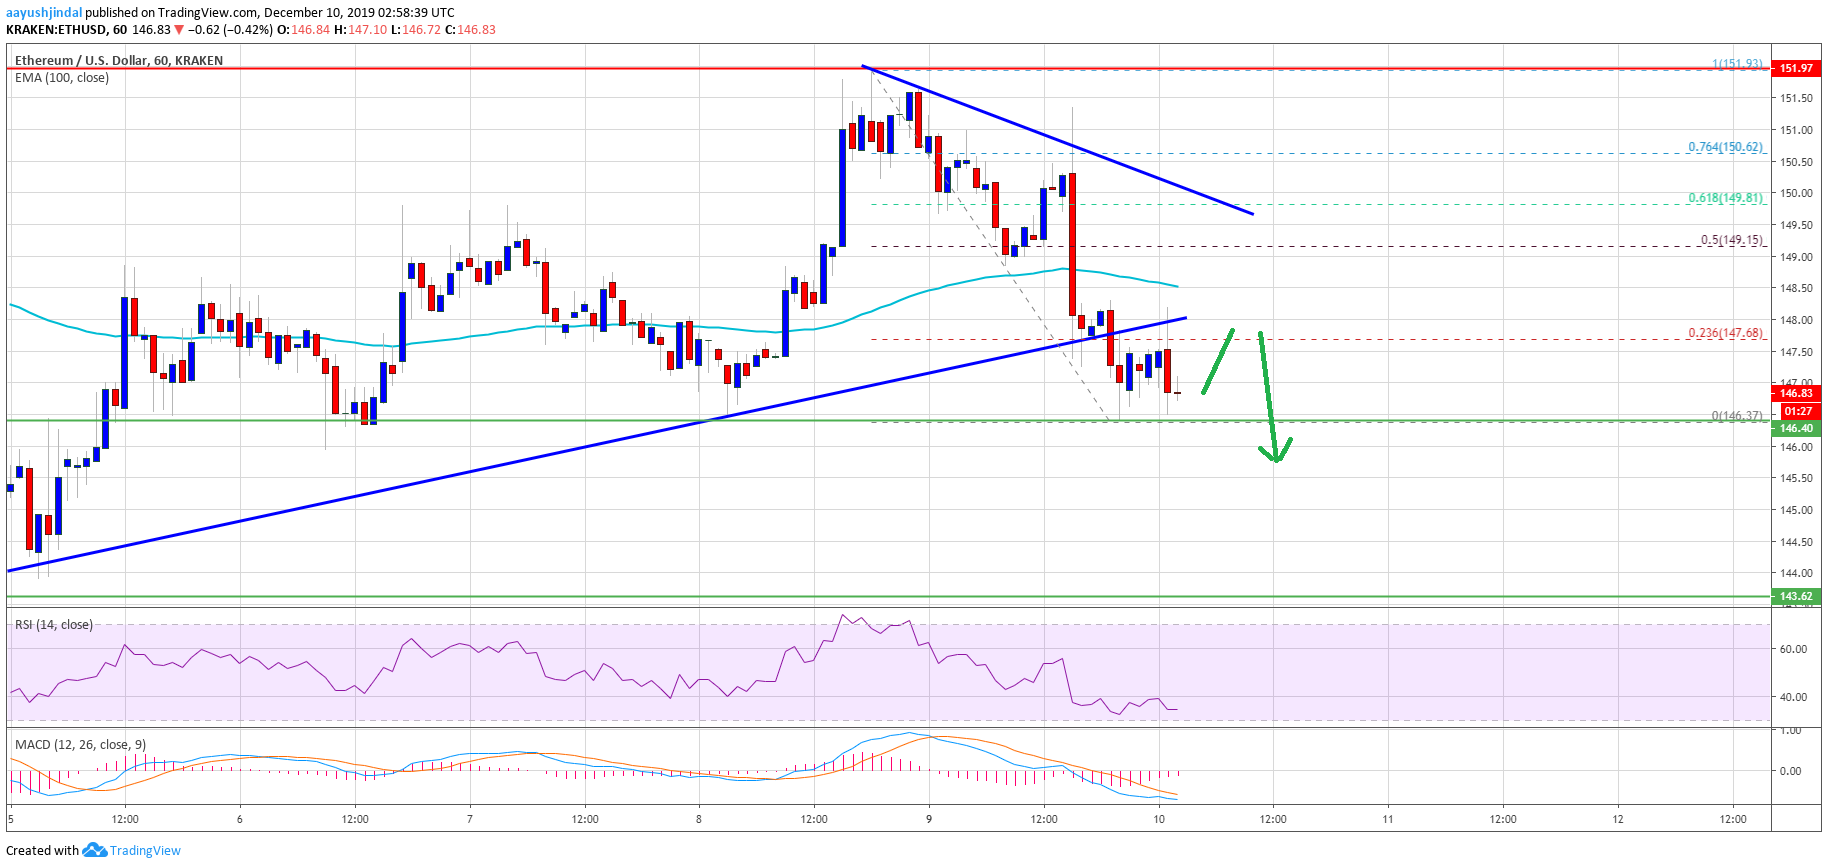
- Ethereum is struggling to clear the key $152 resistance area against the US Dollar.
- The price is declining and it is now trading near the $146 support area.
- Yesterday’s major bullish trend line was breached with support near $148 on the hourly chart of ETH/USD (data feed via Kraken).
- The price could continue to move down and it might test the $144 support zone.
Ethereum price is showing a few bearish signs versus the US Dollar, while bitcoin is down 2%. ETH price must stay above $144 to revisit the $152 resistance area.
Ethereum Price Analysis
Yesterday, Ethereum made another attempt to surpass the $152 resistance area against the US Dollar. However, ETH price struggled to continue higher, formed a top near the $152 level, and declined recently.
The price traded below the $150 and $148 levels. Moreover, there was a close below the $148 level and the 100 hourly simple moving average. Besides, yesterday’s major bullish trend line was breached with support near $148 on the hourly chart of ETH/USD.
The pair is now trading near the $146 support level. If the price fails to stay above the $146 support, it could decline further towards the key $144 area. Any further losses might lead Ethereum towards the $142 level in the near term.
On the upside, an immediate resistance is near the $148 level. Additionally, the 23.6% Fib retracement level of the recent decline from the $152 high to $146 low is also near the $148 level.
The first key resistance is near the $150 level since it is close to the 100 hourly simple moving average. The 50% Fib retracement level of the recent decline from the $152 high to $146 low is also near the $150 level.
More importantly, the $152 level remains a strong barrier for the bulls. Bitcoin price is also declining and struggling to stay above the $7,320 level. Therefore, there is a risk of an extended decline in ETH below the $146 and $144 support levels in the near term.
To move into a positive zone, the price must break the $150 level and gain strength above the $152 hurdle.
Looking at the chart, Ethereum price is clearly back in a range, with a significant resistance near the $152 level. On the downside, the price must stay above $144 or $142 to recover again. If not, it could continue to move down towards $132.
ETH Technical Indicators
Hourly MACD – The MACD for ETH/USD is slowly gaining strength in the bearish zone.
Hourly RSI – The RSI for ETH/USD is now well below the 40 level, with a bearish angle.
Major Support Level – $144
Major Resistance Level – $152