
Reason to trust
How Our News is Made
Strict editorial policy that focuses on accuracy, relevance, and impartiality
Ad discliamer
Morbi pretium leo et nisl aliquam mollis. Quisque arcu lorem, ultricies quis pellentesque nec, ullamcorper eu odio.
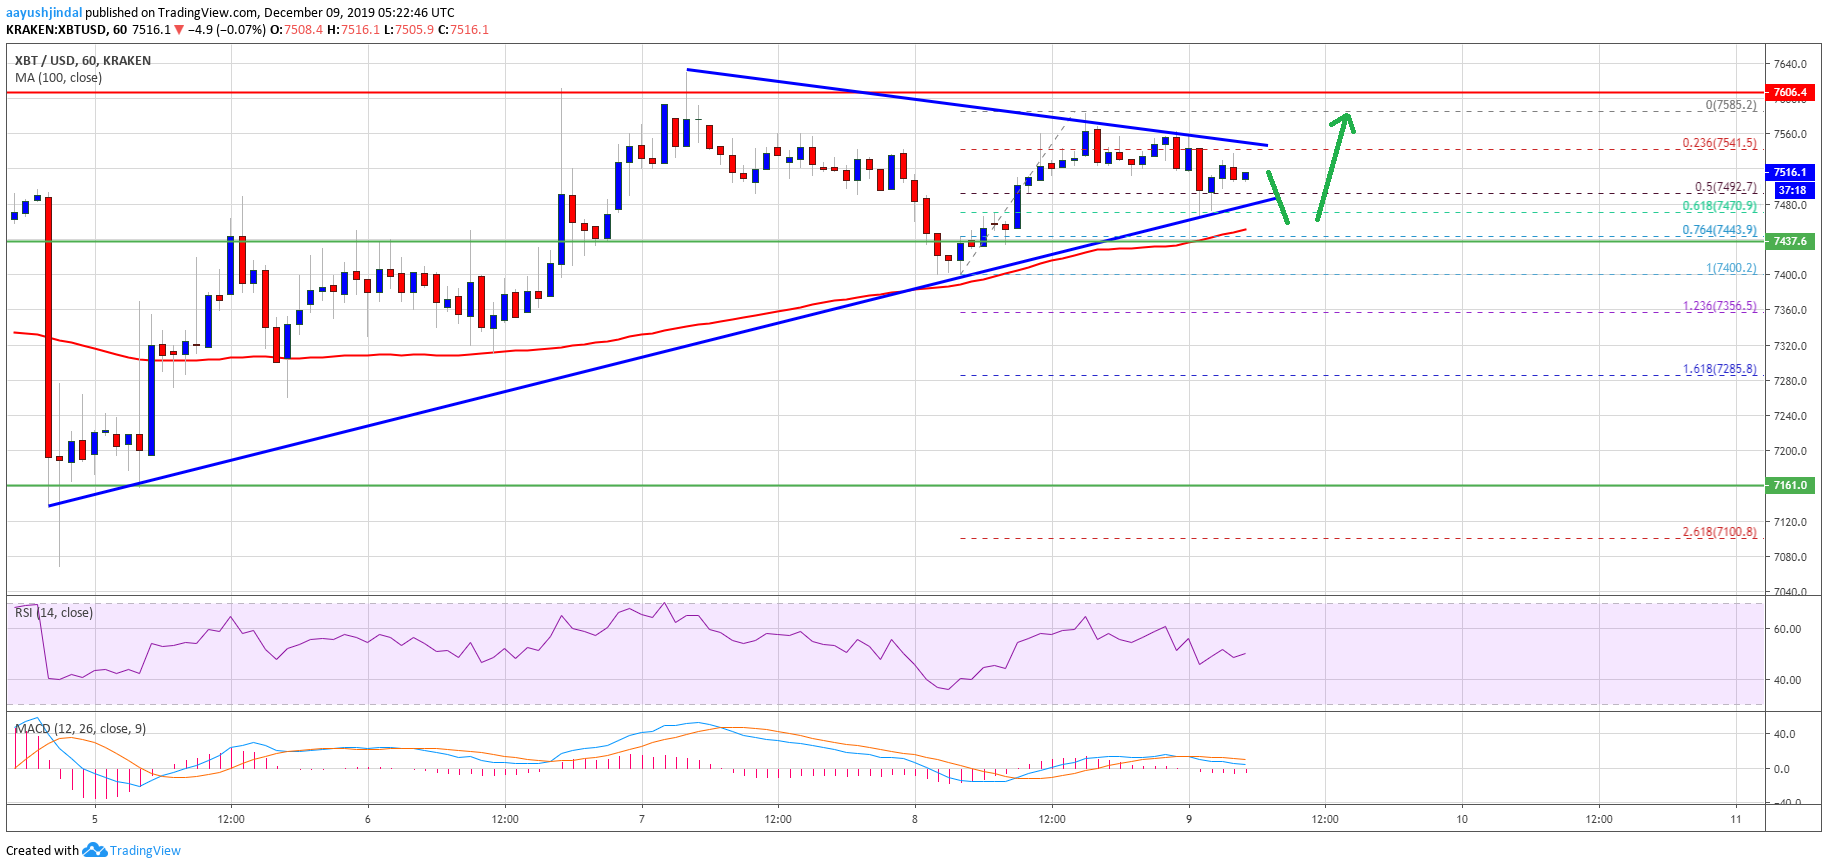
- Bitcoin price is showing positive signs above the $7,400 resistance area against the US Dollar.
- The price is likely to clear the $7,560 and $7,600 resistances to continue higher.
- There is a major bullish trend line forming with support near $7,490 on the hourly chart of the BTC/USD pair (data feed from Kraken).
- The pair could rally once there is a successful close above $7,600 and $7,700 in the coming days.
Bitcoin price is trading in a positive zone above $7,400 against the US Dollar. BTC is likely to test the $8,000 resistance as long as it is above the $7,160 swing low.
Bitcoin Price Analysis
In the past few sessions, there was a steady rise in bitcoin above the $7,320 resistance against the US Dollar. Moreover, BTC price broke the $7,400 resistance area and settled above the 100 hourly simple moving average.
Finally, the price climbed above the $7,500 area and tested the $7,600 resistance area. A high is formed near $7,585 and the price is currently correcting lower.
It broke the $7,550 level, plus the 50% Fib retracement level of the recent wave from the $7,400 low to $7,585 high. Besides, the price spiked below the $7,500 support area.
However, bitcoin buyers were able to protect any further losses below $7,480. Additionally, the 61.8% Fib retracement level of the recent wave from the $7,400 low to $7,585 high also acted as a decent support.
More importantly, there is a major bullish trend line forming with support near $7,490 on the hourly chart of the BTC/USD pair. Therefore, a downside break below the trend line support and $7,500 could trigger an extended downside correction.
The next major support is near the $7,440 level and the 100 hourly simple moving average. Any further losses will most likely lead the price towards the $7,355 level. It represents the 1.236 Fib extension level of the recent wave from the $7,400 low to $7,585 high.
On the upside, there are a few important resistances near $7,580 and $7,600. A successful close above $7,600 and a follow through above $7,700 is likely to start a strong rally towards the $8,000 resistance zone.
Looking at the chart, bitcoin price is clearly showing a lot of positive signs above the $7,400 and $7,440 support levels. In the coming days, there are chances of a decent and steady rise towards the $8,000 level as long as there is no close below $7,160.
Technical indicators:
Hourly MACD – The MACD is about to move back into the bullish zone.
Hourly RSI (Relative Strength Index) – The RSI for BTC/USD is currently just above the 50 level.
Major Support Levels – $7,500 followed by $7,440.
Major Resistance Levels – $7,580, $7,600 and $7,700.


