
Reason to trust
How Our News is Made
Strict editorial policy that focuses on accuracy, relevance, and impartiality
Ad discliamer
Morbi pretium leo et nisl aliquam mollis. Quisque arcu lorem, ultricies quis pellentesque nec, ullamcorper eu odio.
- After forming a base above $7,000, bitcoin price climbed above the $7,500 resistance against the US Dollar.
- The price is currently correcting gains and it is trading below the $7,440 level.
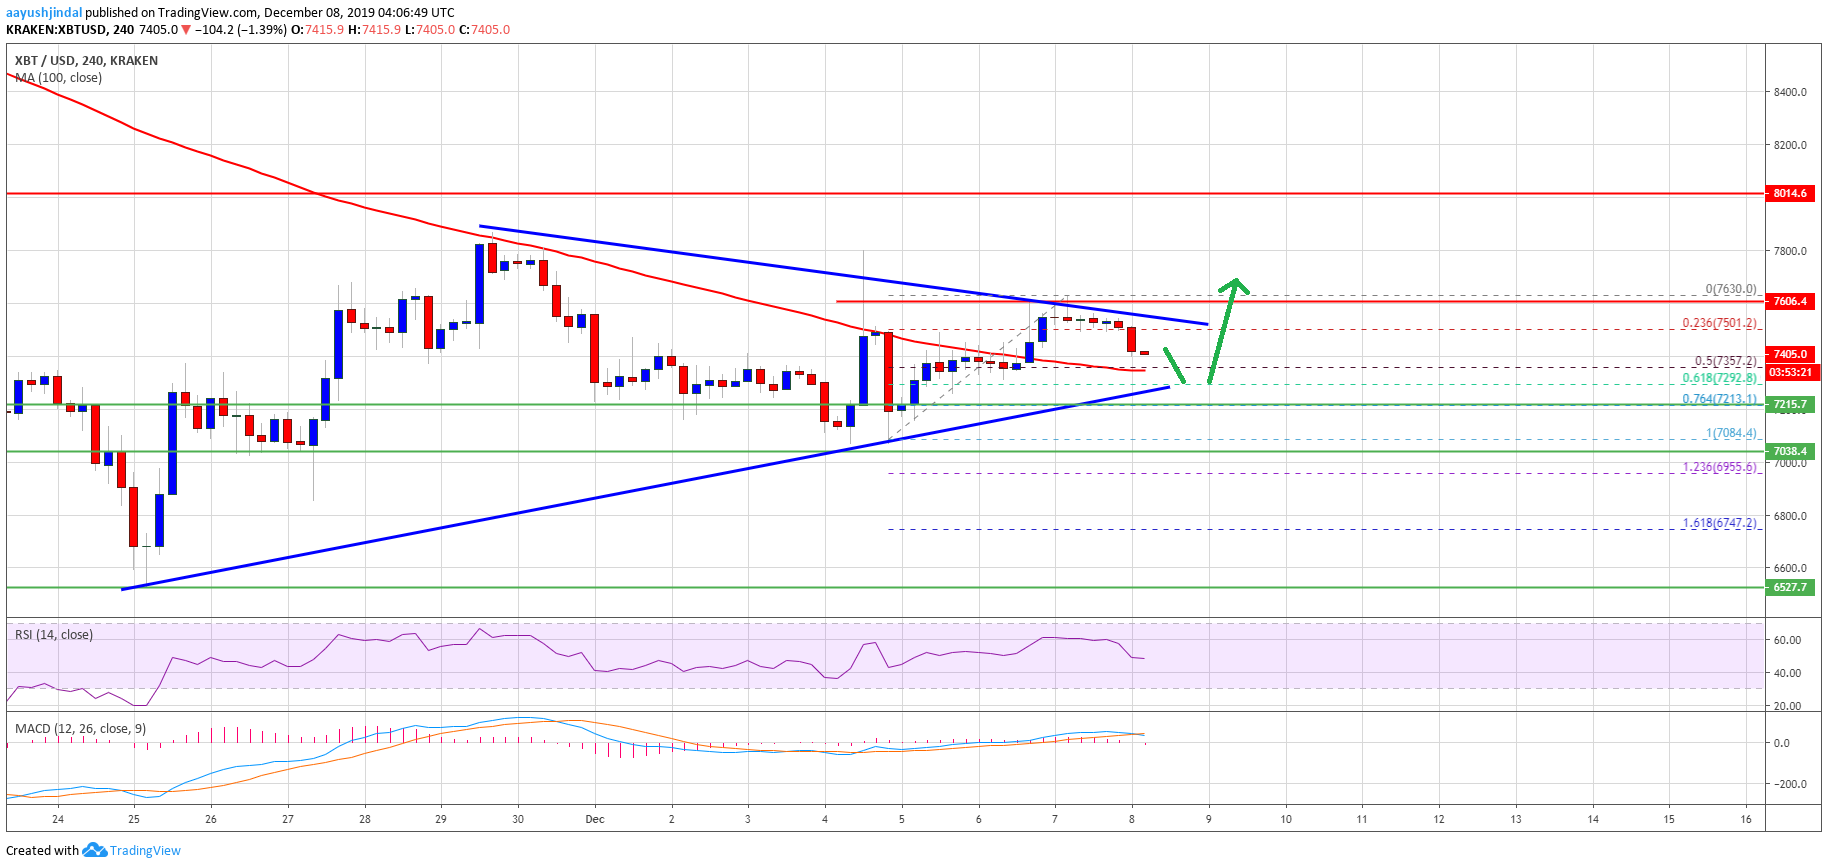
- There is a major contracting triangle forming with resistance near $7,520 on the 4-hours chart of the BTC/USD pair (data feed from Kraken).
- The price is likely to stay above the $7,220 support and it could rally above the $7,500 resistance.
Bitcoin price is trading above a couple of important supports against the US Dollar. BTC is likely to rally and it could surge above the $7,500 resistance as long as above $7,000.
Bitcoin Price Weekly Analysis (BTC)
This past week, bitcoin remained well bid above the $7,000 and $7,080 support levels against the US Dollar. BTC price formed a support base above $7,220 and started a decent recovery wave.
The price climbed above the $7,400 resistance and the 100 simple moving average (4-hours). Moreover, the price surpassed the $7,500 and $7,550 resistance levels. A high was formed near the $7,630 and the price is currently correcting lower.
There was a break below the $7,500 pivot level. Besides, the price traded below the 23.6% Fib retracement level of the upward wave from the $7,084 low to $7,630 high.
On the downside, an immediate support is near the $7,360 level. Additionally, the 50% Fib retracement level of the upward wave from the $7,084 low to $7,630 high is also near the $7,360 level.
The first important support is near the $7,300 level (the previous breakout resistance zone) and the 100 simple moving average (4-hours). Therefore, a downside break below the $7,320 support could increase selling pressure on bitcoin.
The next major support is near the $7,220 level. Any further losses may perhaps lead the price towards the $7,080 support area, below which there is a risk a drop below $7,000.
On the upside, the price is facing a lot of hurdles near the $7,500 level. More importantly, there is a major contracting triangle forming with resistance near $7,520 on the 4-hours chart of the BTC/USD pair. If there is an upside break above the $7,520 resistance, the price could even rally above the $7,630 high.
Looking at the chart, bitcoin price is clearly trading above a couple of key supports near $7,220 and $7,080. Thus, there are high chances of an upside break above $7,530 unless the bulls fail to keep the price above $7,220 and $7,080.
Technical indicators
4 hours MACD – The MACD for BTC/USD is currently losing bullish momentum.
4 hours RSI (Relative Strength Index) – The RSI for BTC/USD is now declining and it is just below the 50 level.
Major Support Level – $7,220
Major Resistance Level – $7,530


