Reason to trust
How Our News is Made
Strict editorial policy that focuses on accuracy, relevance, and impartiality
Ad discliamer
Morbi pretium leo et nisl aliquam mollis. Quisque arcu lorem, ultricies quis pellentesque nec, ullamcorper eu odio.
- Ripple price is trading nicely above the $0.2180 pivot area against the US dollar.
- The price is likely to slowly rise towards the $0.2265 and $0.2300 resistance levels.
- There is a major bullish trend line forming with support near $0.2180 on the hourly chart of the XRP/USD pair (data source from Kraken).
- Ethereum is also rising, but it is struggling to clear the $150 and $152 resistance levels.
Ripple price is back in a positive zone against the US Dollar and bitcoin. XRP price must climb above $0.2265 to continue higher in the near term.
Ripple Price Analysis
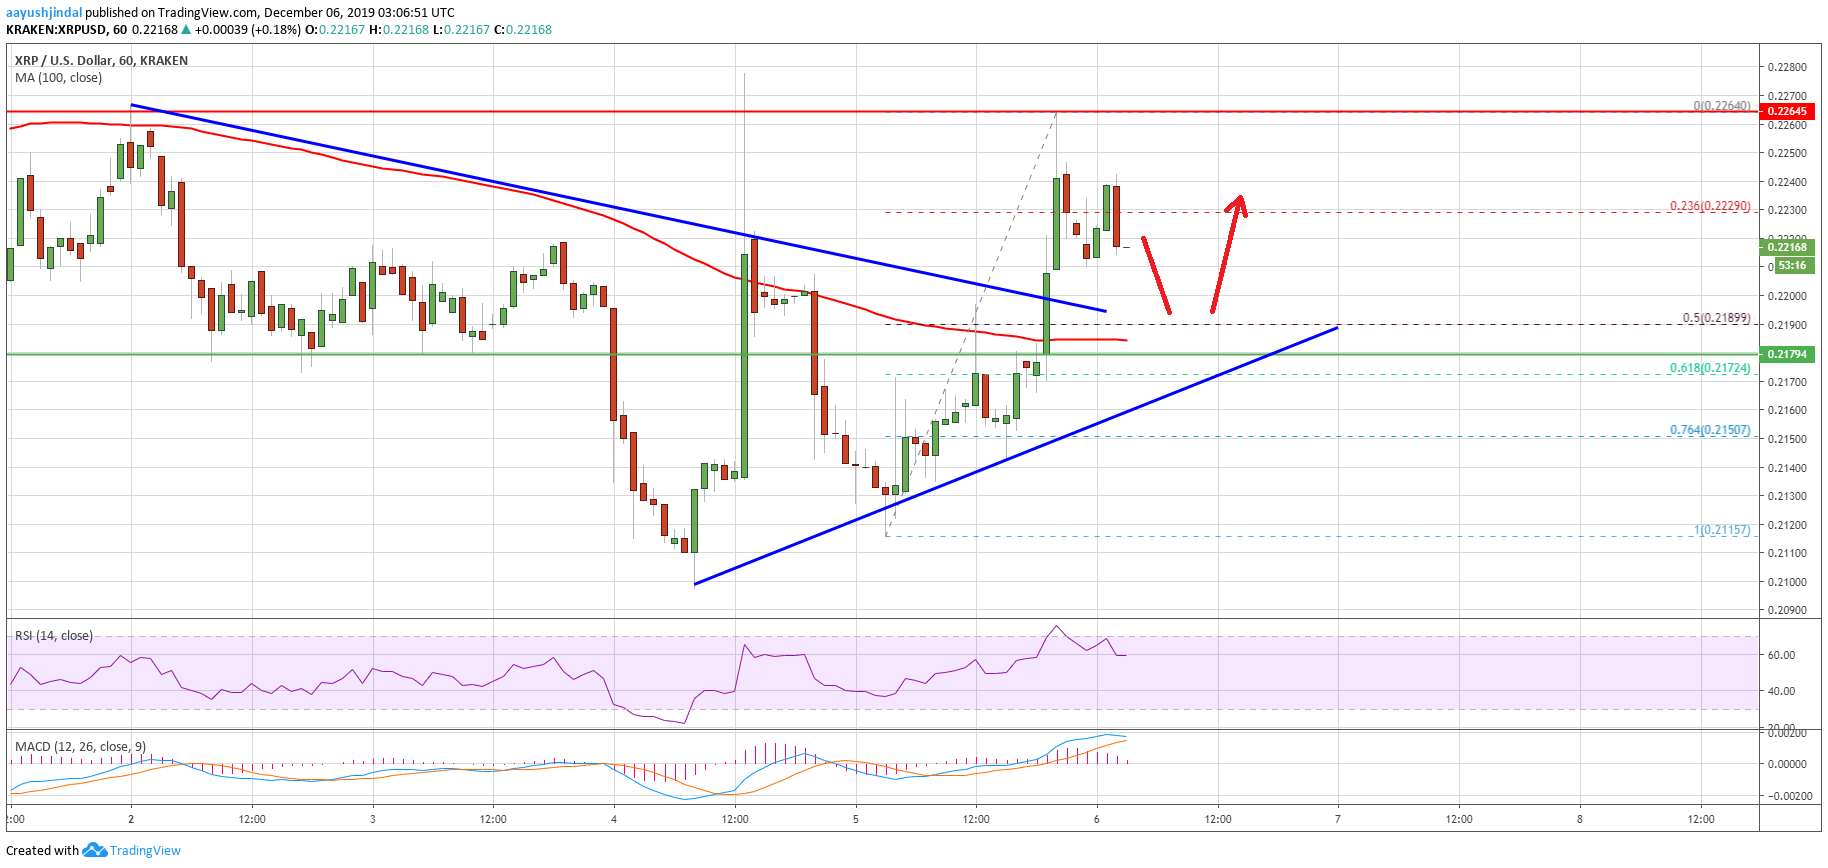
Earlier this week, there was a sharp decline in ripple from the $0.2265 resistance area against the US Dollar. However, the price remained well bid above the $0.2100 support and recently started a fresh increase.
The last swing low was near $0.2115 before the price climbed above the $0.2150 resistance. Moreover, there was a break above the $0.2180 resistance and the 100 hourly simple moving average.
The recent rise was such that the price once again tested the $0.2265 resistance area. A swing high was formed near $0.2264 and the price is currently correcting lower. It broke the 23.6% Fib retracement level of the recent wave from the $0.2115 low to $0.2264 high.
On the downside, there are many supports, starting with $0.2200 and the previous bearish trend line. Additionally, the 100 hourly simple moving average is positioned near the $0.2180 level.
More importantly, there is a major bullish trend line forming with support near $0.2180 on the hourly chart of the XRP/USD pair. The trend line is close to the 50% Fib retracement level of the recent wave from the $0.2115 low to $0.2264 high.
If there is a downside break below the trend line, ripple price could test the $0.2150 support area. Any further downsides may perhaps lead the price towards the $0.2100 support area.
On the upside, an immediate resistance is near the $0.2250 level. Besides, the main resistance is near the $0.2265 level, above which the price is likely to climb towards the $0.2300 and $0.2320 resistance levels.
Looking at the chart, ripple price is showing a few positive signs above the $0.2180 support level. Therefore, there are chances of another attempt to surpass the $0.2265 resistance. If the price fails again, it could dive back towards the $0.2100 support area.
Technical Indicators
Hourly MACD – The MACD for XRP/USD is currently reducing its bullish zone.
Hourly RSI (Relative Strength Index) – The RSI for XRP/USD is currently correcting lower and it could test the 50 level.
Major Support Levels – $0.2180, $0.2150 and $0.2100.
Major Resistance Levels – $0.2250, $0.2265 and $0.2300.