
Reason to trust
How Our News is Made
Strict editorial policy that focuses on accuracy, relevance, and impartiality
Ad discliamer
Morbi pretium leo et nisl aliquam mollis. Quisque arcu lorem, ultricies quis pellentesque nec, ullamcorper eu odio.
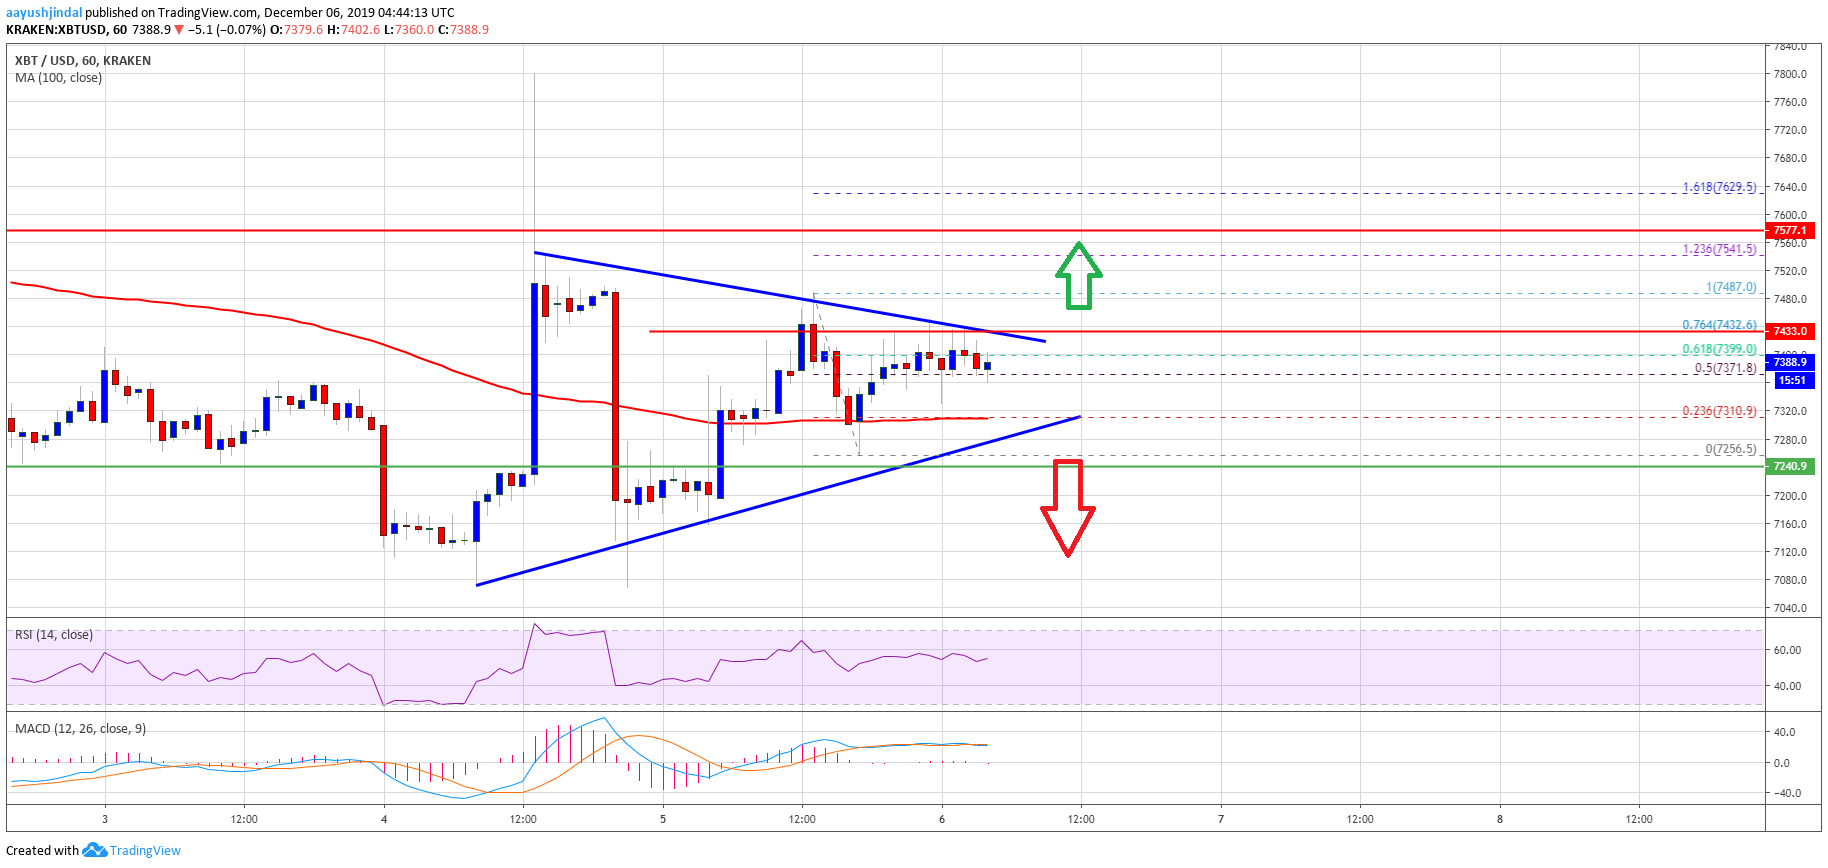
- Bitcoin price is still trading above the $7,200 and $7,240 support levels against the US Dollar.
- The price is struggling to climb above the $7,440 and $7,500 resistance levels.
- There is a major breakout pattern forming with resistance near $7,440 on the hourly chart of the BTC/USD pair (data feed from Kraken).
- The pair could either rally above the $7,500 resistance or it might dive back towards $7,000.
Bitcoin price is likely setting up for the next key break against the US Dollar. BTC must stay above $7,240 to start a strong upward move in the near term.
Bitcoin Price Analysis
Yesterday, bitcoin trimmed gains from well above $7,500 and declined below $7,300 against the US Dollar. Moreover, BTC price broke the $7,200 support area and the 100 hourly simple moving average.
However, the price remained stable above the $7,000 support area. A low was formed near $7,068 and the price started a decent upward move. It broke a couple of important resistances near $7,200 and $7,240.
Besides, the price settled above the $7,240 level and the 100 hourly simple moving average. On the upside, the price seems to be facing a strong resistance near the $7,400 and $7,440 levels.
The last swing high was near $7,487 and the recent low was near $7,256. At the outset, the price is trading above the 50% Fib retracement level of the recent slide from the $7,487 high to $7,256 low.
Though, the $7,400 area is acting as a resistance. Additionally, the 61.8% Fib retracement level of the recent slide from the $7,487 high to $7,256 low is preventing an upside break.
More importantly, there is a major breakout pattern forming with resistance near $7,440 on the hourly chart of the BTC/USD pair. Therefore, an upside break above $7,400 and $7,440 is likely to set the pace for another increase in the near term.
The next major resistance is near the $7,580, above which the price is likely to test the $7,800 area. Conversely, the price could trade below the triangle support at $7,320 and the 100 hourly SMA.
In the bearish case, the $7,240 support holds a lot of importance. If there is a downside break below $7,240, the price is likely to accelerate towards the $7,000 support area.
Looking at the chart, bitcoin price seems to be setting up for the next major bullish break above $7,440. If it fails to climb above $7,440, the bears are likely to take control.
Technical indicators:
Hourly MACD – The MACD is slowly moving into the bullish zone.
Hourly RSI (Relative Strength Index) – The RSI for BTC/USD is currently moving above the 50 level.
Major Support Levels – $7,320 followed by $7,240.
Major Resistance Levels – $7,440, $7,500 and $7,580.


