Reason to trust
How Our News is Made
Strict editorial policy that focuses on accuracy, relevance, and impartiality
Ad discliamer
Morbi pretium leo et nisl aliquam mollis. Quisque arcu lorem, ultricies quis pellentesque nec, ullamcorper eu odio.
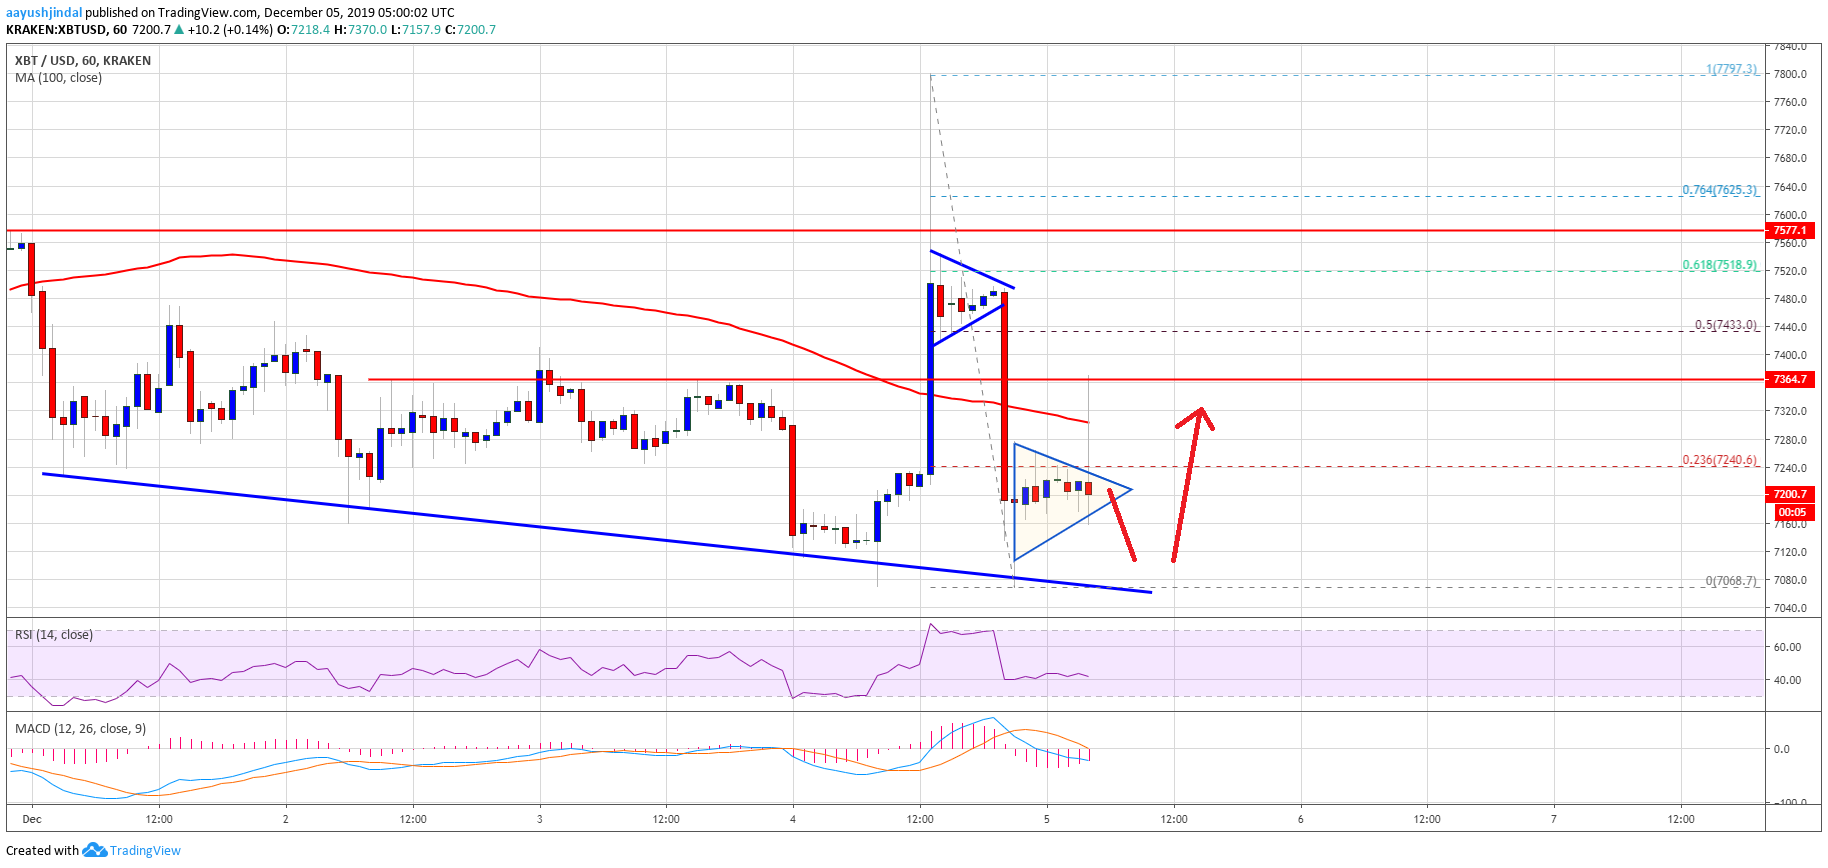
- Bitcoin price is back to where it started and trading below the $7,380 resistance against the US Dollar.
- The price is currently under pressure, but it is likely to hold the $7,100 support area.
- There is a short term contracting triangle forming with resistance near $7,220 on the hourly chart of the BTC/USD pair (data feed from Kraken).
- The pair could rise again towards the $7,380 and $7,400 resistance levels, where sellers might emerge.
Bitcoin price is back in a bearish zone below $7,400 against the US Dollar. BTC is likely to remain capped below the $7,400 and $7,440 resistance levels.
Bitcoin Price Analysis
Yesterday, bitcoin started a strong rise from the $7,080 support area against the US Dollar. BTC price rallied sharply above the $7,200 and $7,300 resistance levels.
Moreover, it surged above the $7,580 resistance area and the 100 hourly simple moving average. However, it failed to remain above $7,500, resulting in a fresh decrease. The price declined heavily below $7,300 and trimmed most its recent gains.
A swing low was formed near $7,068 and the price is currently consolidating losses. It is trading near the 23.6% Fib retracement level of the recent decline from the $7,797 high to $7,068 low.
Besides, there is a short term contracting triangle forming with resistance near $7,220 on the hourly chart of the BTC/USD pair. It seems like bitcoin price might break the triangle resistance and trade above the $7,300 resistance.
The next resistance is near the $7,320 level and the 100 hourly simple moving average. The main resistance area is near the $7,360 and $7,380 levels. The 50% Fib retracement level of the recent decline from the $7,797 high to $7,068 low is also near the $7,440 level.
Therefore, a successful break above the $7,440 resistance is needed for a decent rise in the coming sessions. In the mentioned case, the price may perhaps revisit the $7,580 resistance or the 76.4% Fib retracement level of the recent decline from the $7,797 high to $7,068 low.
Conversely, the price could decline again below the $7,180 and $7,150 levels. The main support is near the $7,000 handle, below which there is a risk of a significant decline.
Looking at the chart, bitcoin price is clearly back in a bearish zone, but it could rise again towards $7,380 or $7,400. Finally, it is likely to test or trade below the $7,000 support.
Technical indicators:
Hourly MACD – The MACD is slowly moving into the bullish zone.
Hourly RSI (Relative Strength Index) – The RSI for BTC/USD is currently rising and it could move above the 50 level.
Major Support Levels – $7,100 followed by $7,000.
Major Resistance Levels – $7,380, $7,400 and $7,580.