
Reason to trust
How Our News is Made
Strict editorial policy that focuses on accuracy, relevance, and impartiality
Ad discliamer
Morbi pretium leo et nisl aliquam mollis. Quisque arcu lorem, ultricies quis pellentesque nec, ullamcorper eu odio.
- Ripple price is declining and it is now trading below the $0.2180 support against the US dollar.
- The price is trading in a downtrend and it seems like the bears are aiming $0.2000.
- This week’s major bearish trend line is still active with resistance near $0.2205 on the hourly chart of the XRP/USD pair (data source from Kraken).
- Ethereum also traded below the key $145 support and it could retest $135.
Ripple price is showing signs of further losses against the US Dollar and bitcoin. XRP price is likely to revisit the main $0.2000 support area in the near term.
Ripple Price Analysis
After ripple failed to break the $0.2260 resistance area against the US Dollar, it started a fresh decline. As a result, XRP price traded below a few key supports near the $0.2220 and $0.2200 levels.
Moreover, there was a break below the $0.2180 support area and the 100 hourly simple moving average. The last swing high was formed near $0.2219 before the price broke the $0.2180 support.
Finally, the price traded below the $0.2150 support and tested the $0.2120 area. A low is formed near $0.2115 and the price is currently consolidating losses. An immediate resistance is near the $0.2140 level.
Besides, the 23.6% Fib retracement level of the recent decline from the $0.2219 high to $0.2115 low is also near $0.2140. The main resistance on the upside is near the $0.2180 level (the previous support area).
Additionally, the 61.8% Fib retracement level of the recent decline from the $0.2219 high to $0.2115 low is also near the $0.2180 level. More importantly, this week’s major bearish trend line is still active with resistance near $0.2205 on the hourly chart of the XRP/USD pair.
To move back into a bullish zone, ripple price needs to surpass many hurdles, starting with $0.2180 and up to $0.2200. The 100 hourly simple moving average is also near $0.2220 to prevent an upside break.
On the downside, an initial support is near the $0.2120 level. The current price action suggests there are high chances of another decline below the $0.2120 and $0.2100 support levels in the near term.
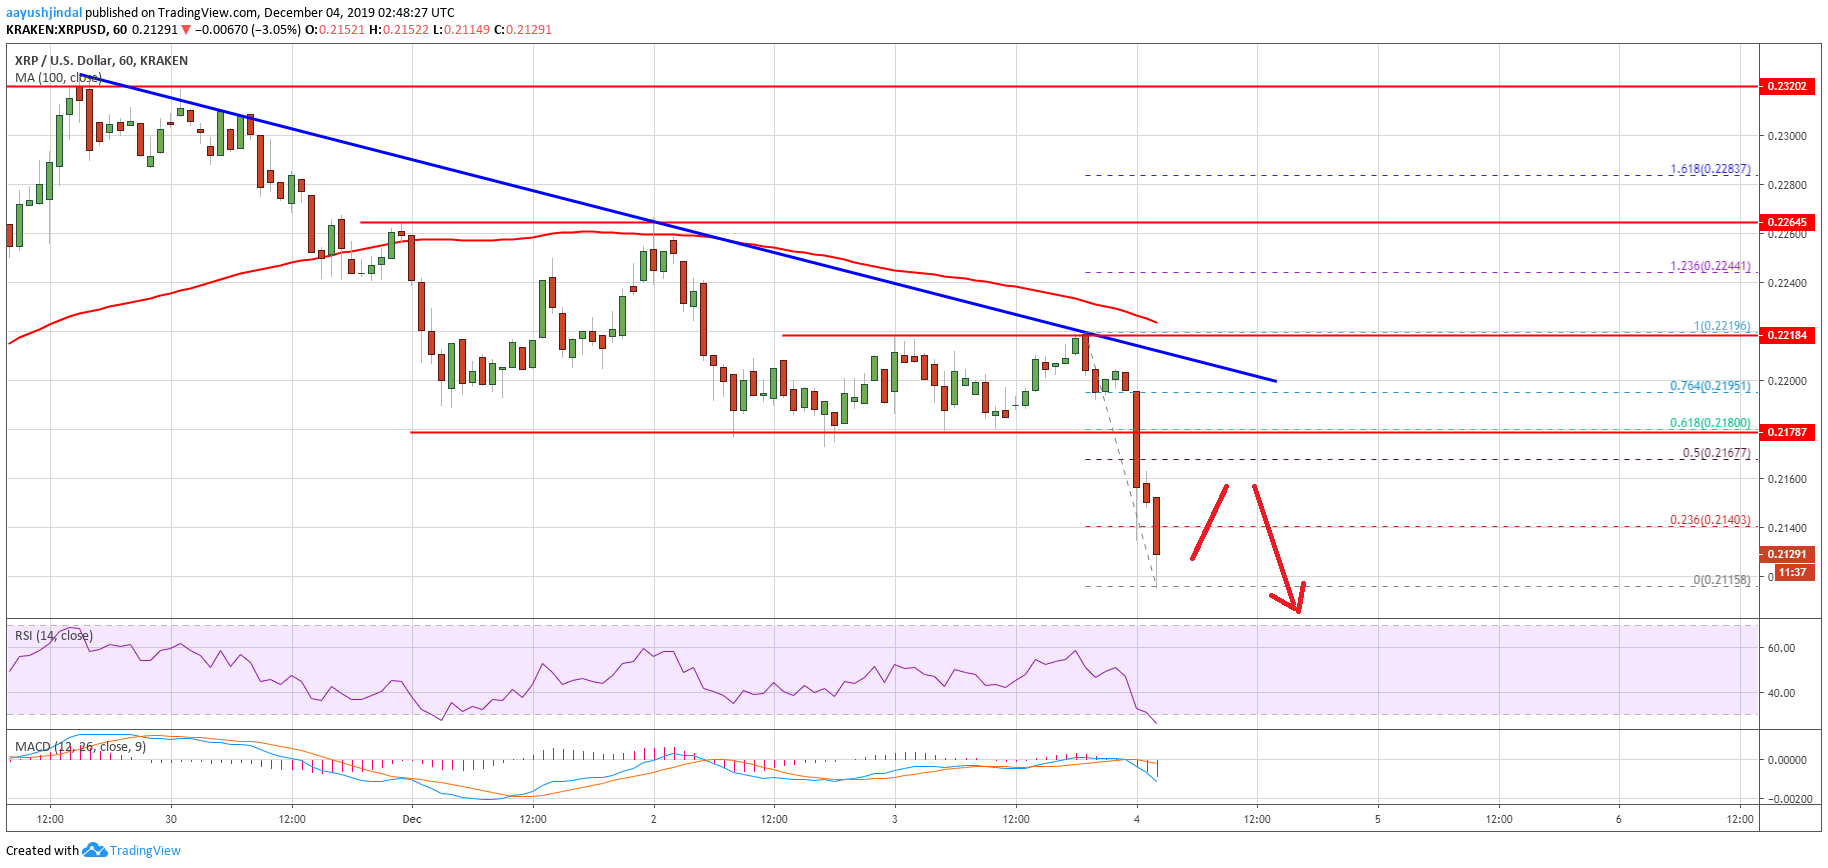
Looking at the chart, ripple price is under a lot of pressure below the $0.2180 pivot level. In the short term, there could be an upside correction, but the price is likely to face sellers near the $0.2180 and $0.2200 levels.
Technical Indicators
Hourly MACD – The MACD for XRP/USD is now gaining pace in the bearish zone.
Hourly RSI (Relative Strength Index) – The RSI for XRP/USD is currently near the oversold region.
Major Support Levels – $0.2120, $0.2100 and $0.2050.
Major Resistance Levels – $0.2140, $0.2180 and $0.2200.