
Reason to trust
How Our News is Made
Strict editorial policy that focuses on accuracy, relevance, and impartiality
Ad discliamer
Morbi pretium leo et nisl aliquam mollis. Quisque arcu lorem, ultricies quis pellentesque nec, ullamcorper eu odio.
- Ethereum is trading above the key $145 and $146 support levels against the US Dollar.
- The price is likely to surpass the $150 and $152 resistance levels in the near term.
- There is a new connecting bearish trend line forming with resistance near $150 on the hourly chart of ETH/USD (data feed via Kraken).
- The price is likely to accelerate higher once it clears the $152 resistance zone.
Ethereum price is holding a couple of key supports versus the US Dollar and bitcoin. ETH price is likely to climb above $152 as long as it is above $146.
Ethereum Price Analysis
Recently, we saw a fresh decrease in Ethereum after it failed to climb above the $158 resistance area against the US Dollar. ETH price traded below the $150 support area and the 100 hourly simple moving average.
However, the $145 and $146 levels provided support. A swing low was formed near $146 and the price started correcting recent losses. It recovered above the $150 level, but it struggled to clear the $152 resistance.
Finally, there was another test of the $146 support and the price is currently consolidating in a range. Moreover, the price is trading above the 23.6% Fib retracement level of the recent decline from the $152 high to $147 low.
An immediate resistance is near the $150 level and the 100 hourly simple moving average. Besides, there is a new connecting bearish trend line forming with resistance near $150 on the hourly chart of ETH/USD.
The 50% Fib retracement level of the recent decline from the $152 high to $147 low is also near the trend line resistance. If there is a clear break above the $150 resistance, Ethereum price could continue to rise.
Therefore, a break above the trend line and the 100 hourly simple moving average could push the price towards the $152 resistance levels. If the bulls gain pace above the $152 resistance, the price is likely to accelerate higher.
The next key resistances are near the $158 and $160 levels. Conversely, the price could struggle to continue above $150 and $150 resistances. In the mentioned case, it may perhaps retest the $146 support.
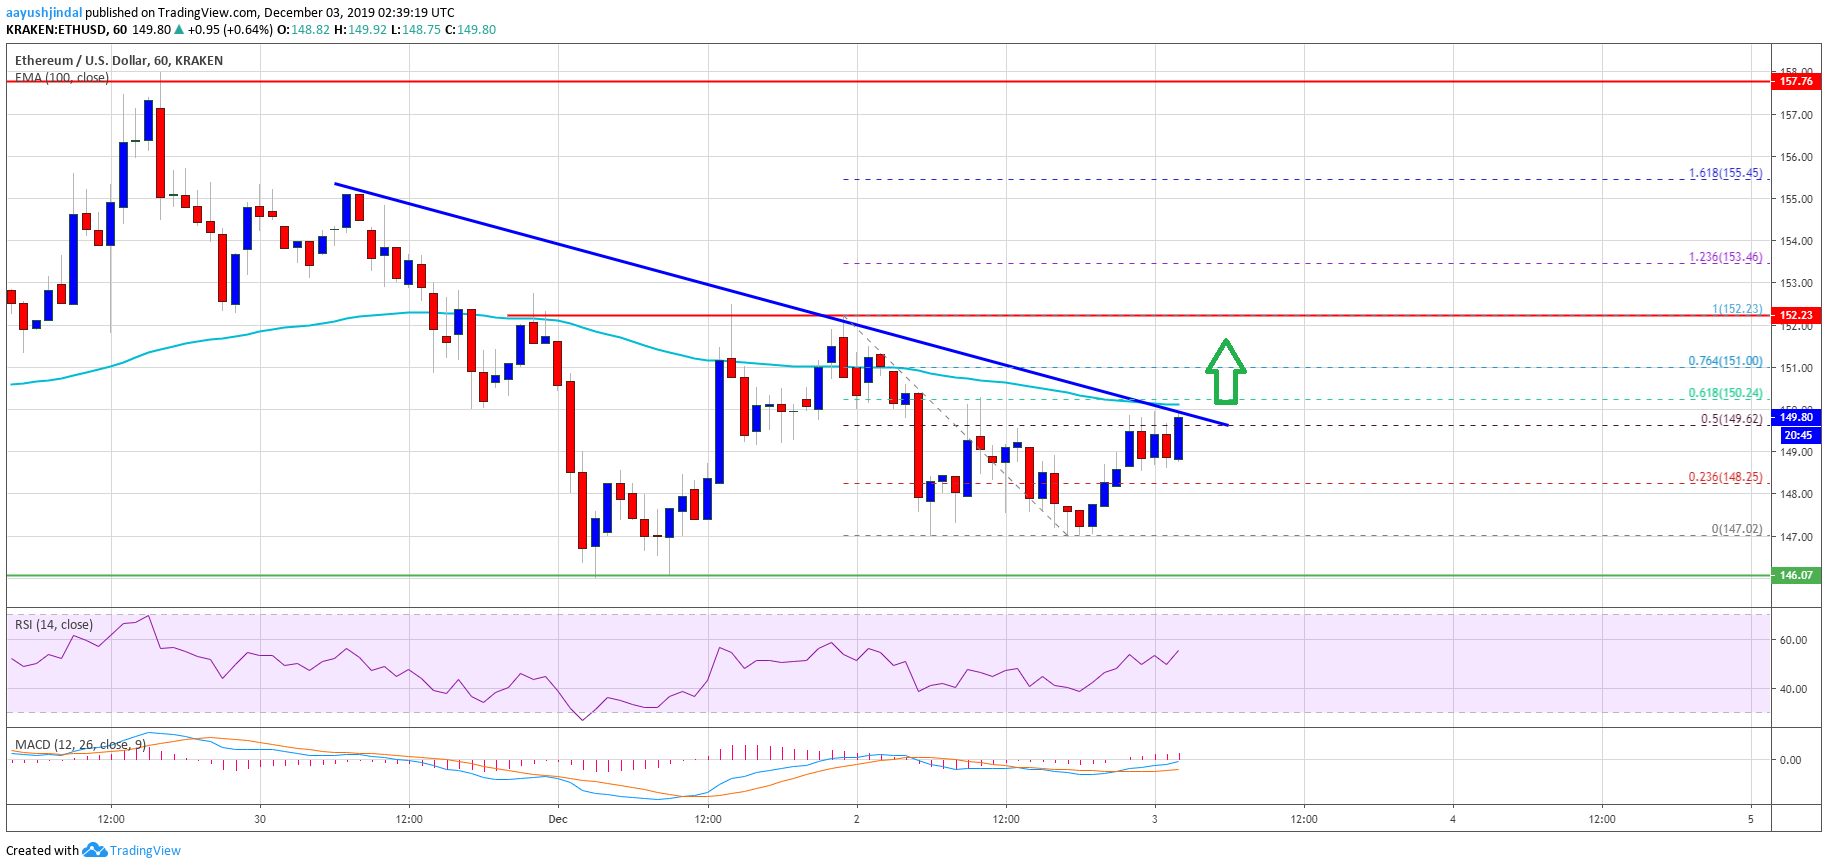
Looking at the chart, Ethereum price is clearly trading near a couple of key hurdles such as $150 and $152. Thus, it could either rally above $152 or attempt a downside break below the $146 support area. The next major support is near the $142 level.
ETH Technical Indicators
Hourly MACD – The MACD for ETH/USD is slowly moving in the bullish zone.
Hourly RSI – The RSI for ETH/USD is currently above the 50 level, with a bullish angle.
Major Support Level – $146
Major Resistance Level – $152