
Reason to trust
How Our News is Made
Strict editorial policy that focuses on accuracy, relevance, and impartiality
Ad discliamer
Morbi pretium leo et nisl aliquam mollis. Quisque arcu lorem, ultricies quis pellentesque nec, ullamcorper eu odio.
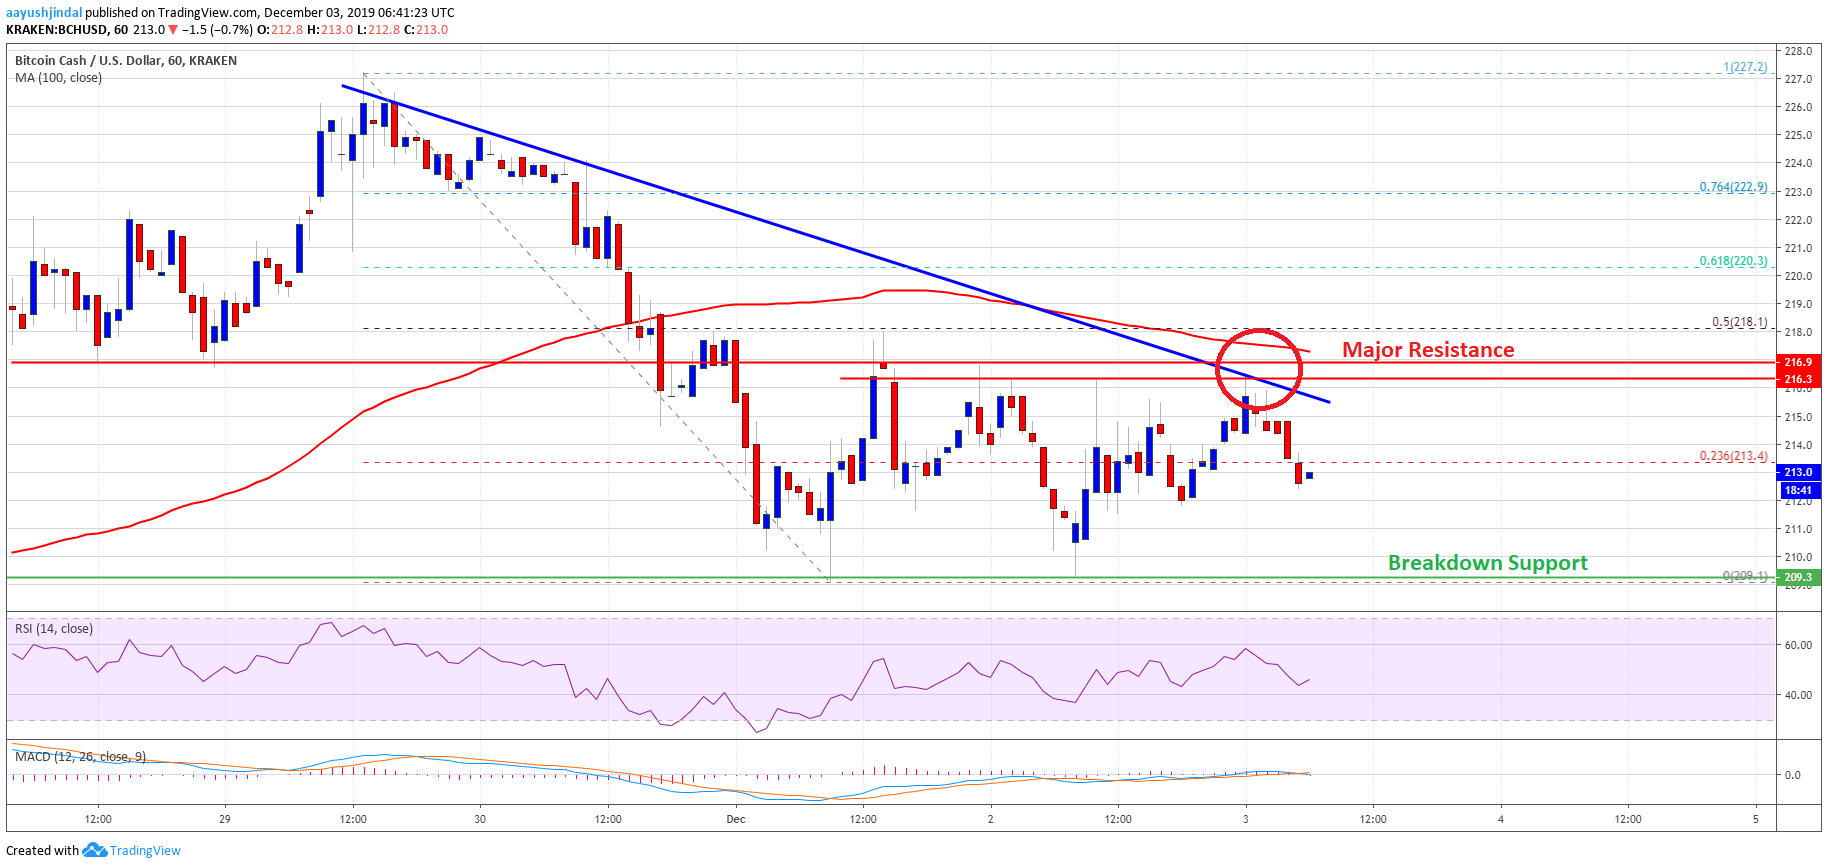
- Bitcoin cash price is facing a strong resistance near the $216 and $218 levels against the US Dollar.
- The price is currently consolidating in a range above the $210 support area.
- There is a major bearish trend line forming with resistance near $215 on the hourly chart of the BCH/USD pair (data feed from Kraken).
- The pair must surpass the $216 resistance area to start a nice upward move.
Bitcoin cash price is facing many resistances near $216 against the US Dollar. BCH/USD could tumble below $210 if it continues to struggle near $216.
Bitcoin Cash Price Analysis
After a steady decline, bitcoin cash price found support near the $210 level against the US Dollar. BCH price traded as low as $209 and recently started an upside correction.
It broke the $213 level, and the 23.6% Fib retracement level of the last key decline from the $227 high to $209 low. However, the price seems to be facing a strong resistance near the $216 and $218 levels.
Similarly, bitcoin is struggling to gain momentum above the $7,400 resistance area and Ethereum is finding it hard to continue higher above $152.
On the upside, BCH seems to be struggling near the $216 level and the 100 hourly simple moving average. Besides, the 50% Fib retracement level of the last key decline from the $227 high to $209 low is near the $218 level.
More importantly, there is a major bearish trend line forming with resistance near $215 on the hourly chart of the BCH/USD pair. Therefore, an upside break above the $216 and $218 resistance levels is must for bullish continuation.
The next set of resistances is near the $225 level. An intermediate resistance is near the 61.8% Fib retracement level of the last key decline from the $227 high to $209 low at $220.
On the other hand, the price could fail to surpass $216 and $218. In the mentioned case, the price is likely to retest the $210 support area. Any further losses may perhaps lead the price towards the $200 support area.
Looking at the chart, bitcoin cash price seems to be consolidating below the main $216 and $218 resistance levels. In the short term, there could be ranging moves above the $210 support before the price either rallies towards $227 or revisit the $200 support area.
Technical indicators
Hourly MACD – The MACD for BCH/USD is currently losing momentum and moving into the bearish zone.
Hourly RSI (Relative Strength Index) – The RSI for BCH/USD is still below the 50 level, with a minor bullish angle.
Key Support Levels – $210 and $200.
Key Resistance Levels – $216 and $218.