Reason to trust
How Our News is Made
Strict editorial policy that focuses on accuracy, relevance, and impartiality
Ad discliamer
Morbi pretium leo et nisl aliquam mollis. Quisque arcu lorem, ultricies quis pellentesque nec, ullamcorper eu odio.
- Ripple price is holding a couple of important supports near $0.2180 and $0.2150 against the US dollar.
- The price is currently facing resistance near the $0.2260 and $0.2300 levels.
- There is a major bearish trend line forming with resistance near $0.2260 on the hourly chart of the XRP/USD pair (data source from Kraken).
- The pair needs to climb above the $0.2260 and $0.2300 resistance levels to continue higher.
Ripple price is struggling to gain bullish momentum against the US Dollar and bitcoin. XRP price might revisit the $0.2180 or $0.2150 support before it climbs higher.
Ripple Price Analysis
After forming a local top near the $0.2320 level, ripple started a fresh decline against the US Dollar. XRP price declined below the $0.2250 support level and the 100 hourly simple moving average.
Moreover, the price broke the $0.2200 support and tested the $0.2180 support zone. A low was formed near the $0.2188 and the price recently started an upside correction.
There was a break above the $0.2220 resistance area. Besides, the price climbed above the 23.6% Fib retracement level of the latest decline from the $0.2325 high to $0.2188 low.
However, the price is facing a lot of hurdles near the $0.2250 and $0.2260 resistance levels. It seems like the 50% Fib retracement level of the latest decline from the $0.2325 high to $0.2188 low is acting as a resistance.
More importantly, there is a major bearish trend line forming with resistance near $0.2260 on the hourly chart of the XRP/USD pair. Finally, the 100 hourly simple moving average is acting as a strong resistance near $0.2250.
Therefore, a clear break above the $0.2260 resistance area and the 100 hourly simple moving average could open the doors for more gains. The next major resistance is near the $0.2300 level. It is near the 76.4% Fib retracement level of the latest decline from the $0.2325 high to $0.2188 low.
On the downside, an initial support is near the $0.2220 level. If there is a downside break below $0.2200, the price could continue to decline towards the $0.2180 support. The main support is near the $0.2150 level.
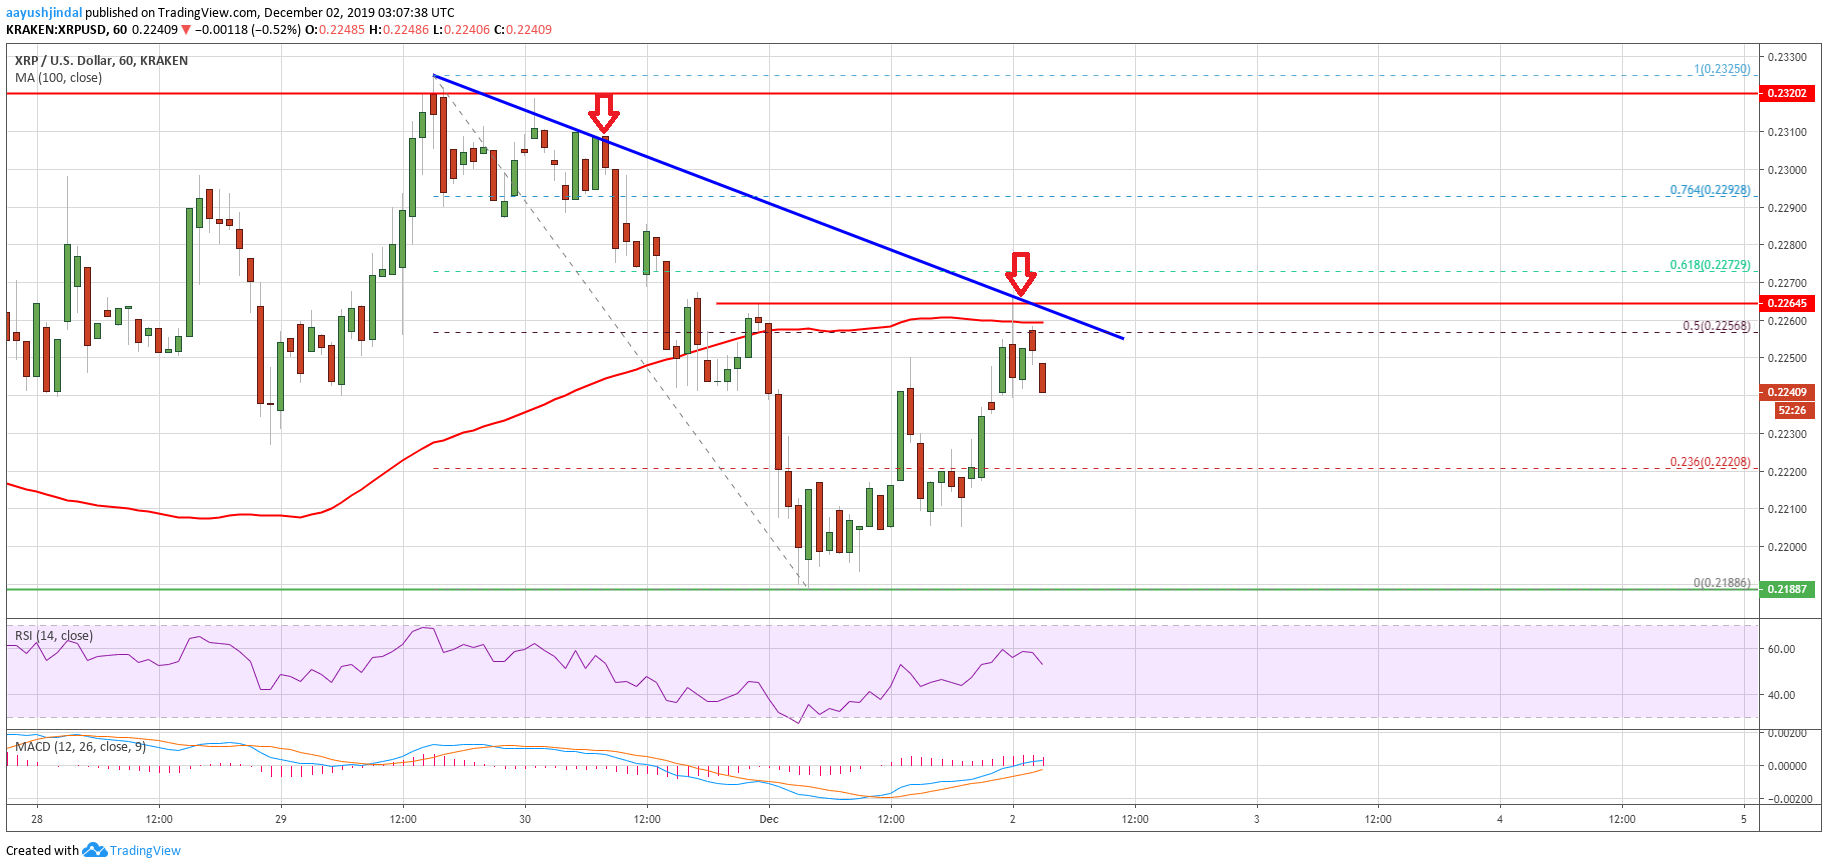
Looking at the chart, ripple price is facing a couple of important resistances near $0.2250. Thus, the bears might eye another decline below the $0.2220 and $0.2200 support levels. Having said that, the bulls might appear if the price tests the $0.2150 support area.
Technical Indicators
Hourly MACD – The MACD for XRP/USD is about to move back into the bearish zone.
Hourly RSI (Relative Strength Index) – The RSI for XRP/USD is currently declining and is just below the 50 level.
Major Support Levels – $0.2220, $0.2200 and $0.2180.
Major Resistance Levels – $0.2250, $0.2560 and $0.2300.