
Reason to trust
How Our News is Made
Strict editorial policy that focuses on accuracy, relevance, and impartiality
Ad discliamer
Morbi pretium leo et nisl aliquam mollis. Quisque arcu lorem, ultricies quis pellentesque nec, ullamcorper eu odio.
- Bitcoin price is struggling to hold a couple of important supports near $7,200 against the US Dollar.
- The price is likely to continue lower below the $7,200 and $7,000 support levels.
- There is a major bearish trend line forming with resistance near $7,390 on the hourly chart of the BTC/USD pair (data feed from Kraken).
- The pair could even revisit the $6,500 support area once it settles below the $7,000 support.
Bitcoin price is facing a fresh round of selling below $7,400 against the US Dollar. BTC has likely turned sell on rallies near the $7,400 resistance area.
Bitcoin Price Analysis
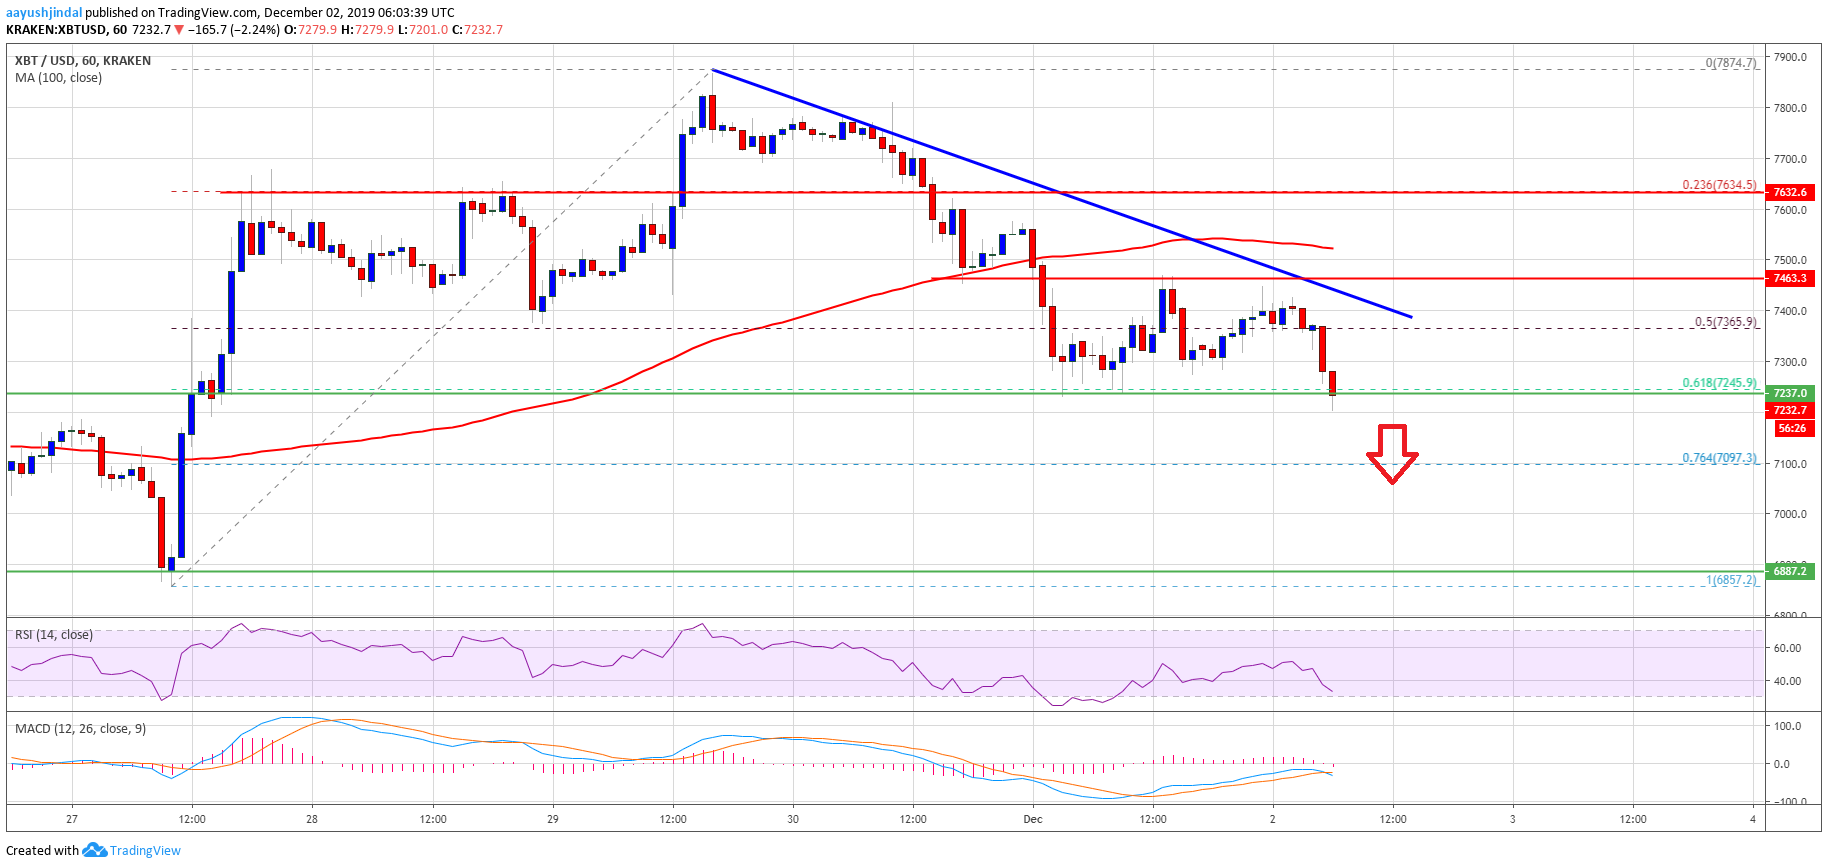
After a nice recovery above the $7,500 resistance, bitcoin struggled to gain strength above $7,700 and $7,800 levels against the US Dollar. BTC traded as high as $7,874 and recently started a fresh decline.
It broke the $7,630 and $7,500 support levels to enter a bearish zone. Moreover, there was a break below the 50% Fib retracement level of the upward wave from the $6,857 swing low to $7,874 high.
The price is now trading below the $7,400 support and the 100 hourly simple moving average. An immediate support is near the $7,200 level. Currently, it seems like bitcoin is about to trade below the 61.8% Fib retracement level of the upward wave from the $6,857 swing low to $7,874 high.
If there is a downside break below the $7,200 support area, the price could revisit the $7,000 support area. Additionally, an intermediate support is near the 76.4% Fib retracement level of the upward wave from the $6,857 swing low to $7,874 high.
The bears are gaining momentum and if the price clears the $7,000 support, there is a risk of a sharp decline. In the mentioned scenario, the price may perhaps revisit the $6,500 support area in the near term.
On the upside, there is a key resistance forming near the $7,400 level. Besides, there is a major bearish trend line forming with resistance near $7,390 on the hourly chart of the BTC/USD pair.
Therefore, a clear break above the $7,400 resistance is needed for a fresh increase. Furthermore, the next immediate resistance is near the $7,500 level and the 100 hourly simple moving average.
Looking at the chart, bitcoin price is under a lot of pressure below the $7,400 level and it seems like it could continue to move down towards $7,000 or even $6,800.
Technical indicators:
Hourly MACD – The MACD is gaining pace in the bearish zone.
Hourly RSI (Relative Strength Index) – The RSI for BTC/USD is currently declining and it is closing towards the 30 level.
Major Support Levels – $7,200 followed by $7,000.
Major Resistance Levels – $7,400, $7,500 and $7,700.


