
Reason to trust
How Our News is Made
Strict editorial policy that focuses on accuracy, relevance, and impartiality
Ad discliamer
Morbi pretium leo et nisl aliquam mollis. Quisque arcu lorem, ultricies quis pellentesque nec, ullamcorper eu odio.
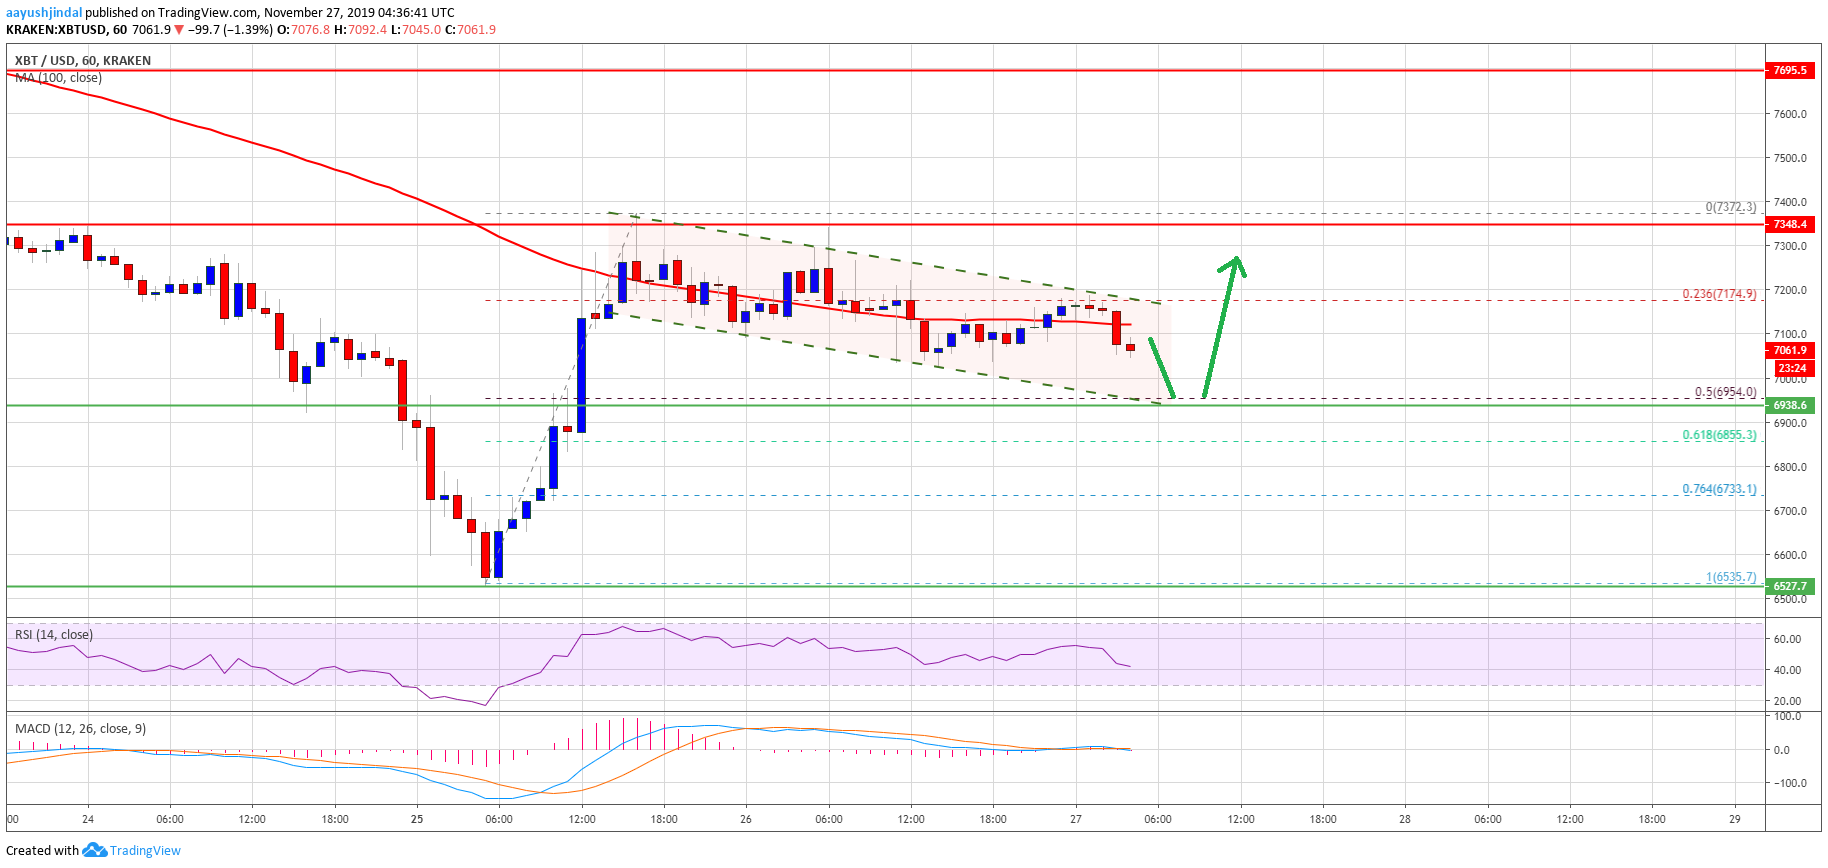
- Bitcoin is currently trimming gains after struggling to clear the $7,400 barrier against the US Dollar.
- The price is likely to stay above the $7,000 and $6,950 support levels in the near term.
- There is likely a bullish flag forming with resistance near $7,170 on the hourly chart of the BTC/USD pair (data feed from Kraken).
- There are chances of a nice upward move if the price surges above $7,200 and $7,400.
Bitcoin price is trading below a few key resistance such as $7,400 against the US Dollar. Having said that, BTC seems to be forming a bullish continuation pattern as long as $6,950 holds.
Bitcoin Price Analysis
Yesterday, there was a decent start of an upside correction from the $6,535 low against the US Dollar. BTC climbed nicely above the $6,800 and $7,000 resistance levels.
Besides, it spiked above the $7,200 resistance area and the 100 hourly simple moving average. However, the price struggled to continue above the $7,375 and $7,400 resistance levels.
A high was formed near $7,372 and the price is currently trimming gains. Bitcoin traded below the $7,200 level and the 100 hourly simple moving average. Moreover, there was a break below the 23.6% Fib retracement level of the recent rise from the $6,535 low to $7,372 high.
On the downside, there are a few key supports near the $7,025, $7,000 and $6,950 levels. The main support for the current wave is near $6,950 since it is near the 50% Fib retracement level of the recent rise from the $6,535 low to $7,372 high.
If there is downside break and close below $6,950, the price is likely to resume its decline. The next supports are near the $6,660 and $6,540 levels. On the upside, an initial resistance is near the $7,150 level and the 100 hourly SMA.
More importantly, there is likely a bullish flag forming with resistance near $7,170 on the hourly chart of the BTC/USD pair. Therefore, an upside break above $7,200 might set the pace for more upsides and recovery.
The main resistance area is near the $7,375 and $7,400 levels. A successful close and follow through above $7,400 will most likely set the pace for a strong recovery.
Looking at the chart, bitcoin price is holding a couple of important supports near $6,950. As long as there is no close below $6,950, there are chances of upside continuation above $7,200 and $7,400.
Technical indicators:
Hourly MACD – The MACD is slowly moving back into the bearish zone.
Hourly RSI (Relative Strength Index) – The RSI for BTC/USD is currently below the 50 level.
Major Support Levels – $7,000 followed by $6,950.
Major Resistance Levels – $7,200, $7,375 and $7,400.


