
Reason to trust
How Our News is Made
Strict editorial policy that focuses on accuracy, relevance, and impartiality
Ad discliamer
Morbi pretium leo et nisl aliquam mollis. Quisque arcu lorem, ultricies quis pellentesque nec, ullamcorper eu odio.
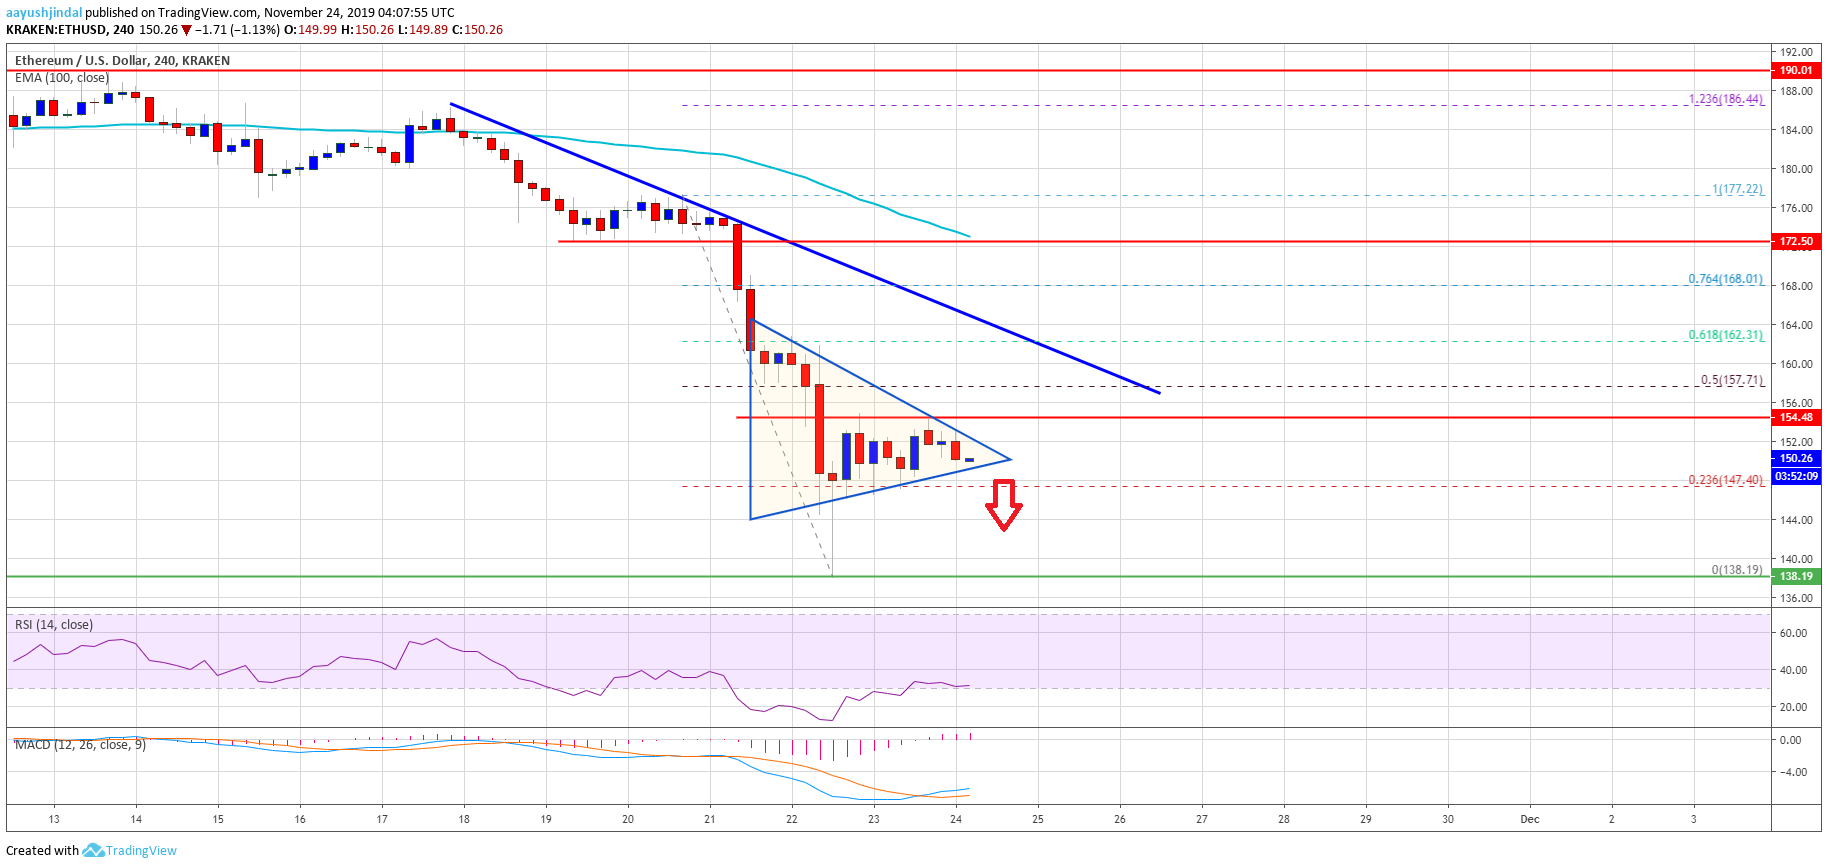
- ETH price is down more than $30 in the past few days against the US Dollar.
- The price even spiked below $150 and it is currently correcting higher.
- There is a major breakout pattern forming with resistance near $152 on the 4-hours chart of ETH/USD (data feed via Kraken).
- The pair is struggling to correct higher and it could resume its decline below $150.
Ethereum price is trading in a bearish zone below $155 and $160 against the US Dollar, similar to bitcoin. ETH price is likely to revisit $125 before it could recover.
Ethereum Price Weekly Analysis
This past week, Ethereum declined heavily after it broke the key $172 support against the US Dollar. ETH price traded below many key supports near the $170 and $165 levels.
Moreover, there was a break below the $150 support and the price settled well below the 100 simple moving average (4-hours). A new multi-month low was formed near $138 and the price recently corrected higher.
It broke the $145 and $150 resistance levels. Besides, Ethereum recovered above the 23.6% Fib retracement level of the downward move from the $177 high to $138 low.
However, the price seems to be facing a strong resistance near the $155 level. More importantly, there is a major breakout pattern forming with resistance near $152 on the 4-hours chart of ETH/USD.
Therefore, an upside break above the $152 and $155 levels might push the price higher. An immediate resistance is near the $158 level. It represents the 50% Fib retracement level of the downward move from the $177 high to $138 low.
The main resistance is near $160 and a connecting bearish trend line on the same chart. A clear break above the $155 and $160 resistance levels could start a decent recovery. In the mentioned case, the price could recover towards the $172 resistance.
On the downside, an immediate support is near the $150 level. If there is a downside break below the $150 support, the price is likely to retest $140.
Any further downsides may perhaps open the doors for a push towards the $132 and $130 support levels. The next major support is near the $125 level, where the bulls may emerge.
The above chart indicates that Ethereum price is under a lot of pressure below the $155 and $160 resistance levels. Overall, there are chances of more downsides below $150 and $140 in the near term.
Technical Indicators
4 hours MACD – The MACD for ETH/USD is slowly moving into the bullish zone.
4 hours RSI – The RSI for ETH/USD is currently recovering, but it is well below the 40 level.
Major Support Level – $140
Major Resistance Level – $160


