
Reason to trust
How Our News is Made
Strict editorial policy that focuses on accuracy, relevance, and impartiality
Ad discliamer
Morbi pretium leo et nisl aliquam mollis. Quisque arcu lorem, ultricies quis pellentesque nec, ullamcorper eu odio.
- Bitcoin price is down 6% and tested $7,400 (discussed in the medium term outlook) against the US Dollar.
- The price is showing no signs of a strong recovery and remains at a risk below $7,800.
- There is a key contracting triangle forming with resistance near $7,650 on the hourly chart of the BTC/USD pair (data feed from Kraken).
- A daily close below $7,400 could open the doors for a push towards $6,500 (as discussed in the recent medium term outlook).
Bitcoin price is declining heavily below $7,800 and $7,600 against the US Dollar. The $7,400 support holds the key, below which BTC could eye a test of $6,500.
Bitcoin Price Analysis
In the recent medium term outlook, I discussed the chances of bitcoin declining further below $8,000 against the US Dollar. The first major bearish target was $7,400 and BTC price did test the same in the recent decline.
After struggling to recover above the $8,000 level and the 100 hourly simple moving average, there was a sharp decline. The price is down around 6% and it broke many supports near $7,800 and $7,600.
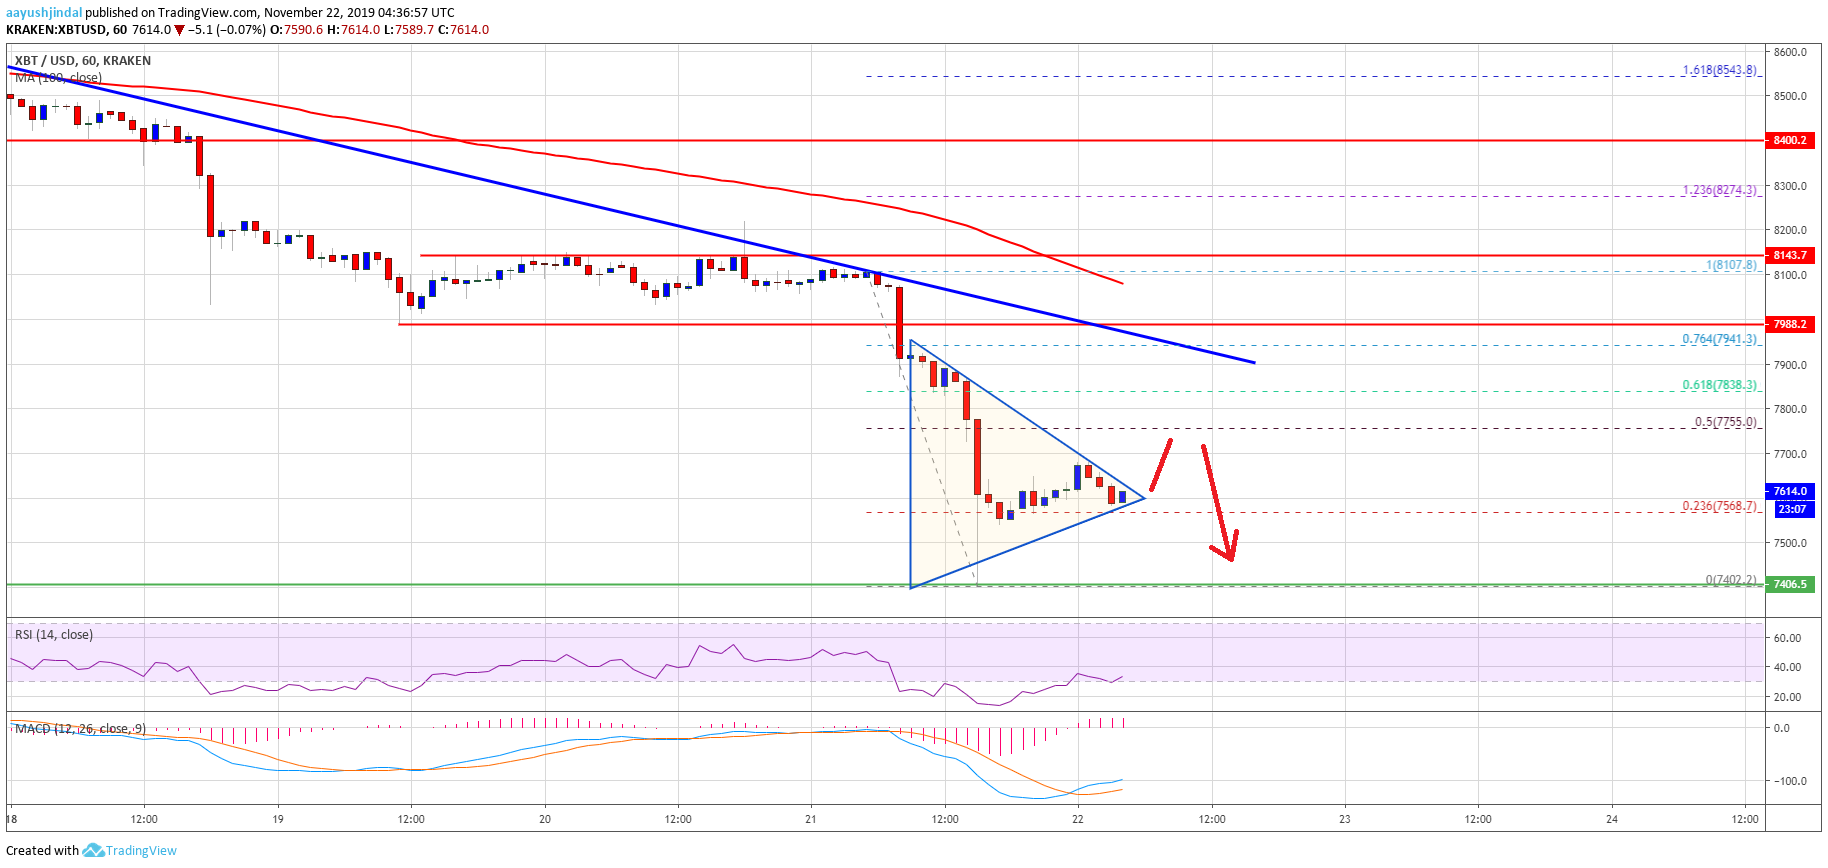
Finally, the price tested the first major bearish target was $7,400 and a new monthly low was formed near $7,402. The price is currently correcting above the $7,500 level. Moreover, it traded above the 23.6% Fib retracement level of the recent drop from the $8,107 high to $7,402 low.
However, the price is struggling to gain strength above $7,640. Additionally, there is a key contracting triangle forming with resistance near $7,650 on the hourly chart of the BTC/USD pair.
If there is an upside break above $7,640 and $7,650, bitcoin price may perhaps test the next resistance near $7,755. It represents the 50% Fib retracement level of the recent drop from the $8,107 high to $7,402 low.
The next major resistance is near the $7,825 level and a connecting bearish trend line on the same chart. Therefore, the price must climb above the $7,825 and $8,000 levels to move into a positive zone.
Conversely, there could be another breakdown below $7,500 and $7,400. Should there be a daily close below $7,400, the price is likely to accelerate further lower. An initial support is near the $7,200 level. Having said that, the price could even aim the $6,500 support area (the next major bearish target).
Looking at the chart, bitcoin price is trading near a major support at $7,400. Thus, there are chances of a decent recovery above $7,800. On the other hand, the price could aim a larger bearish wave below $7,400.
Technical indicators:
Hourly MACD – The MACD is slowly moving in the bullish zone.
Hourly RSI (Relative Strength Index) – The RSI for BTC/USD is currently recovering and is above the 30 level.
Major Support Levels – $7,500 followed by $7,400.
Major Resistance Levels – $7,640, $7,825 and $8,000.


